Dividend yield: looking behind the scene
Everybody knows about one of the most popular investment strategies – dividend investing. Buy stocks with high dividend yield, collect the dividends and reinvest the proceeds again into these stocks. Sounds so simple. However, there is a caveat. Someday a company with a high dividend yield may not be able to pay the dividends. What determines company’s ability to pay the dividends? Let’s look behind the scene.
Dividend yield
Formula for calculating dividend yield is very simple: take company’s paid dividend and divide it by market cap. Or looking from another angle: divide dividend per share by share price:
DIVIDEND YIELD = DIVIDEND PER SHARE / SHARE PRICE
Then, sort companies by the dividend yield and choose the stocks with the highest yield:
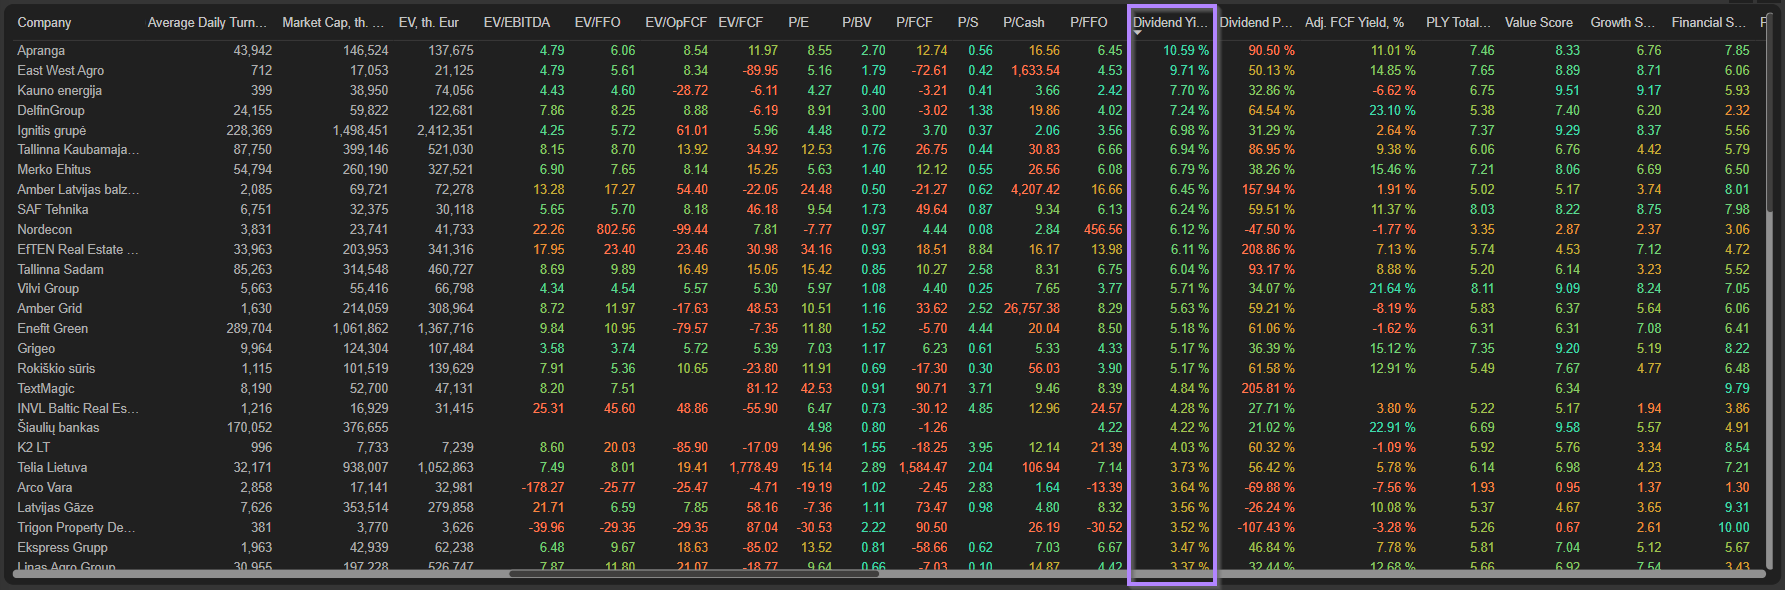
However, that’s where the complications begin.
Consistent dividend policy
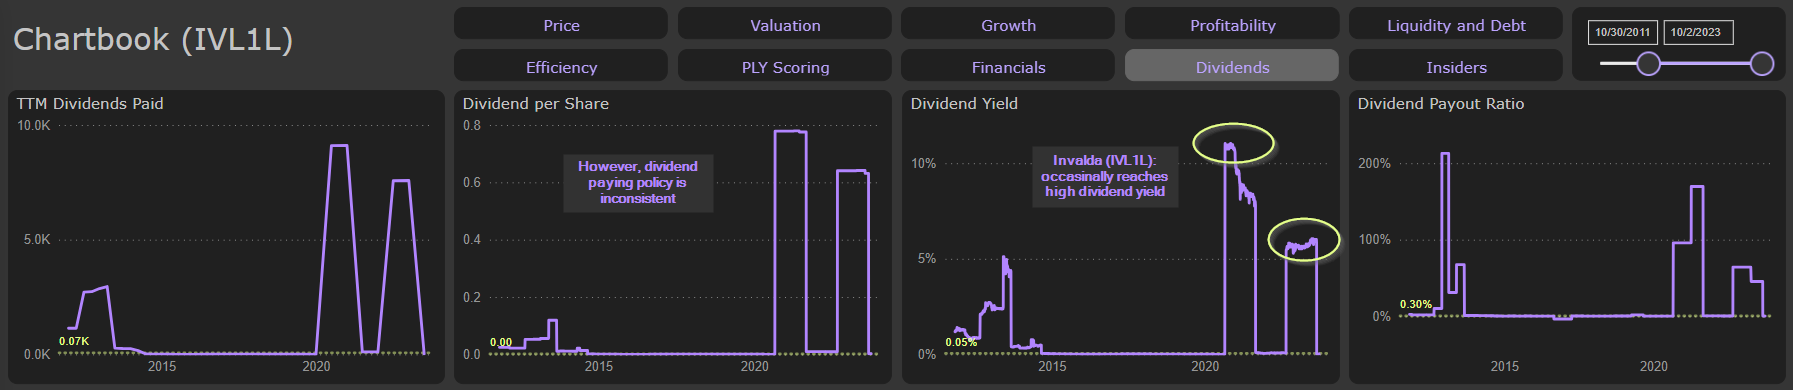
First of all, make sure that company is paying dividends consistently. High dividend yield could be result of a one-time or special dividend, which will not be repeated in the future. Stocks of such companies are not very suitable candidates for the dividend portfolio. Just look at the consistency of dividend yield and dividend paying history to make quick evaluation of the company’s dividend policy.
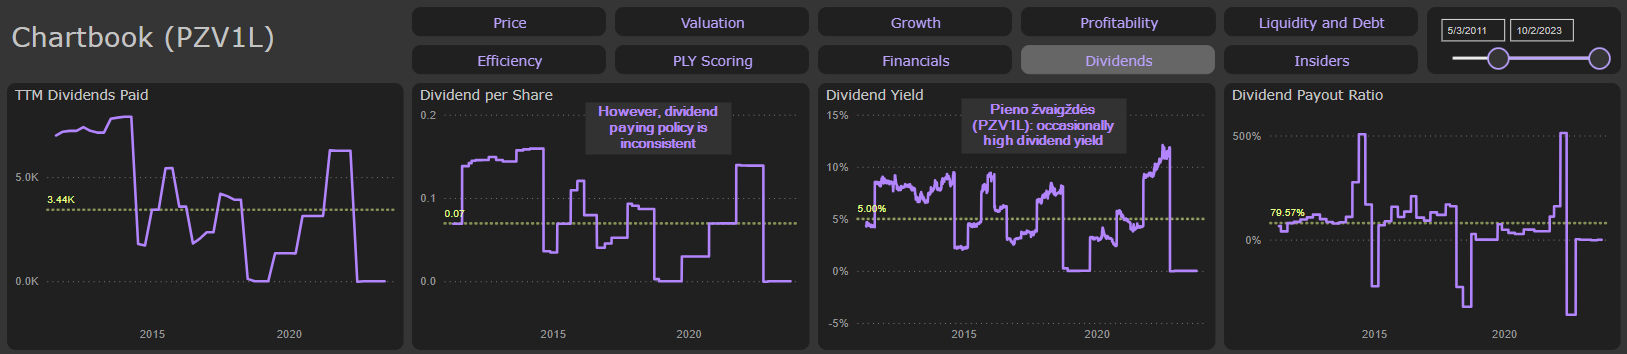
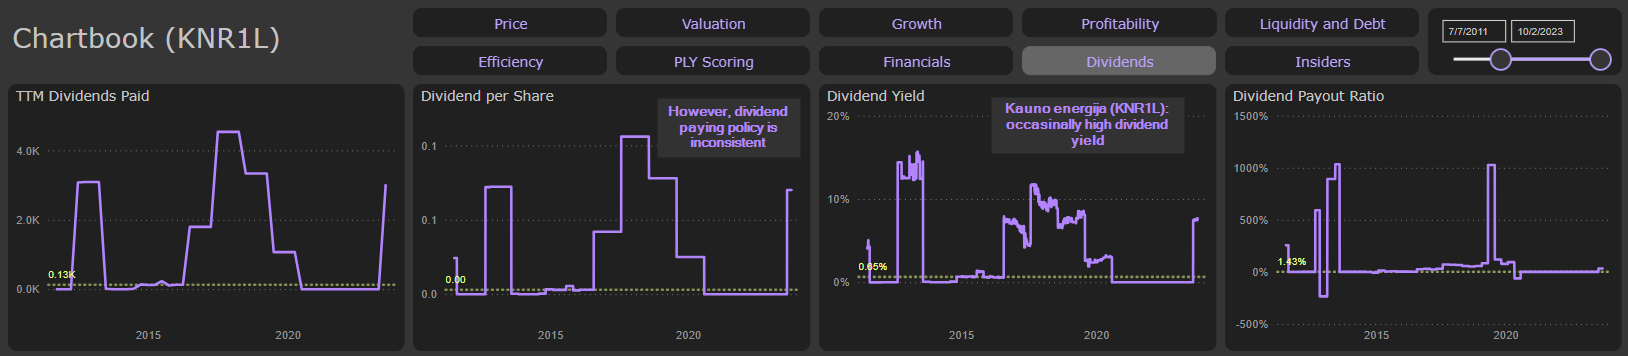
For example, stock of such companies as Invalda (IVL1L), Pieno žvaigždės (PZV1L), Kauno energija (KNR1L) sometimes exhibited dividend yield around 10%, however their inconsistent dividend paying policy does not allow to classify them as dividend stocks:
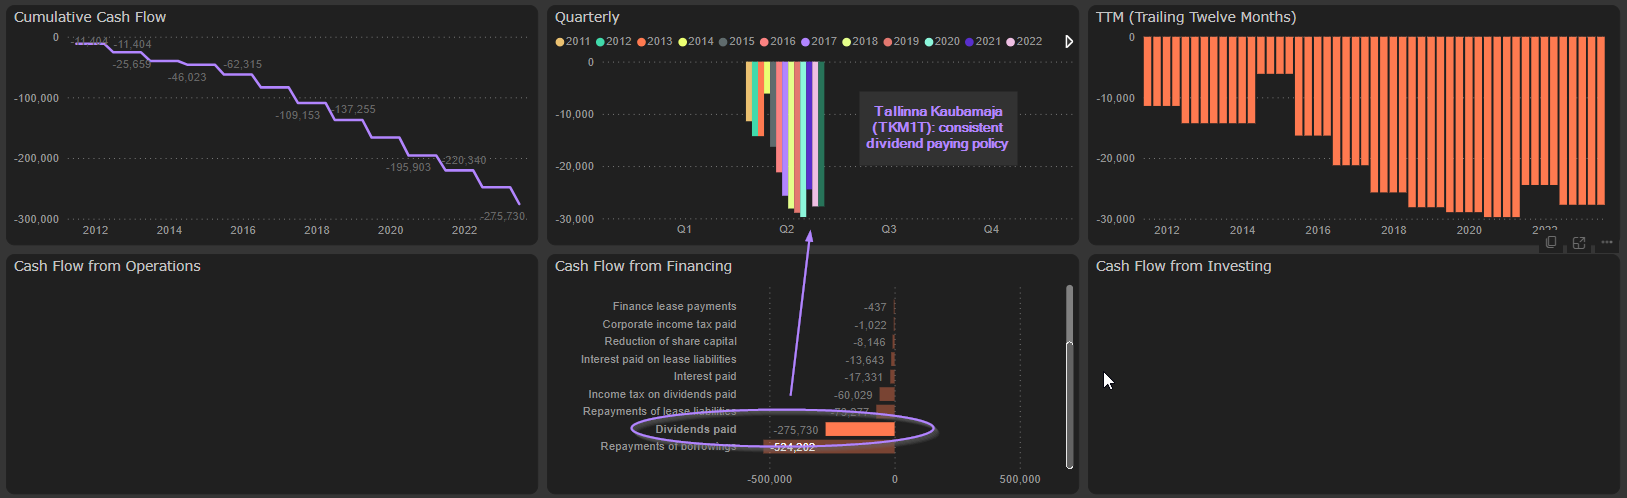
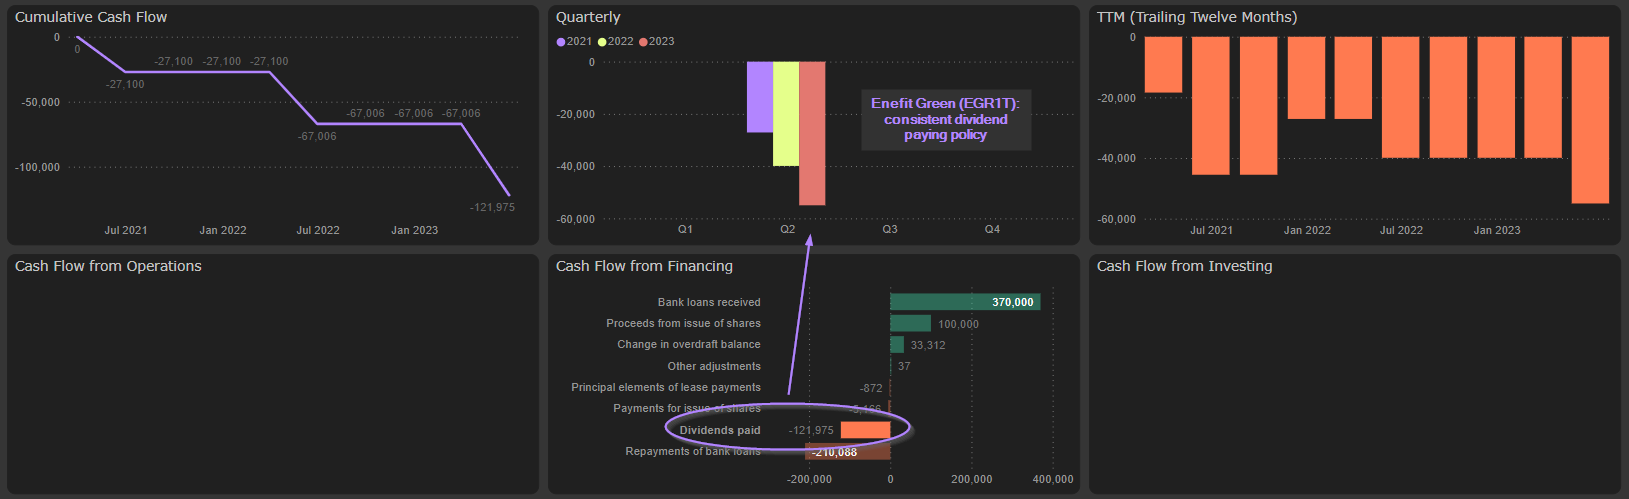
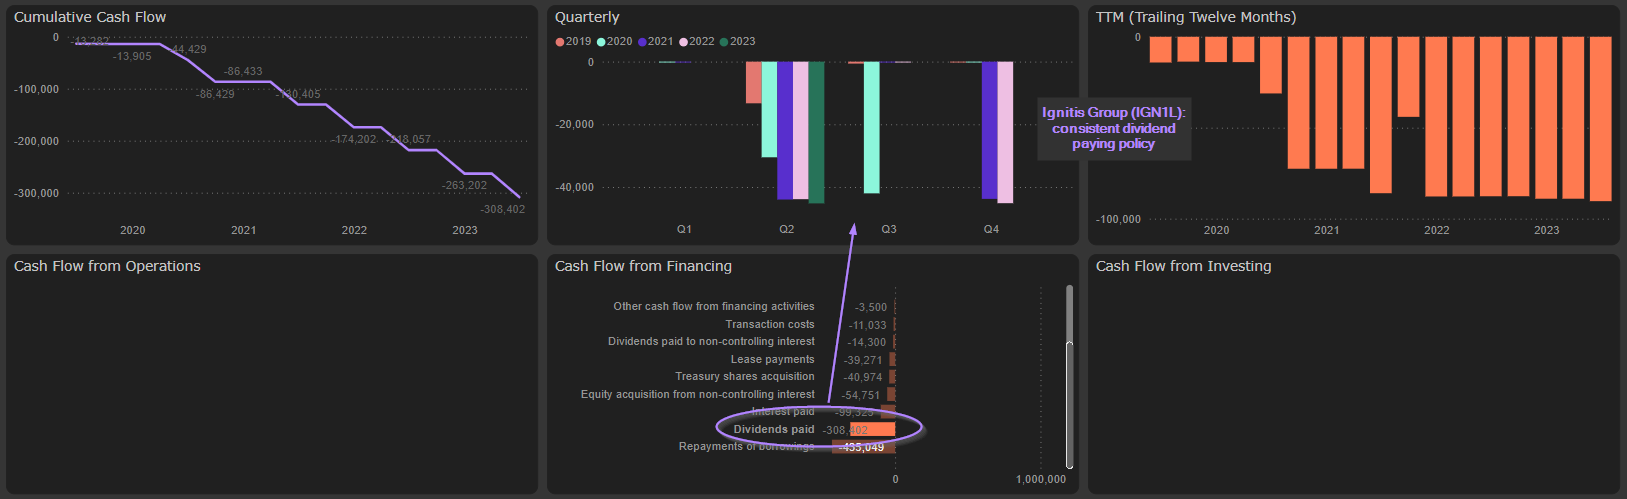
On the other hand, such companies as Tallinna Kaubamaja (TKM1T), Enefit Green (EGR1T), Ignitis Group (IGN1L), Telia Lietuva (TEL1L), Merko (MRK1T) demonstrate very consistent dividend policy:
Dividend payout ratio
Next, pay attention to the dividend payout ratio. That is the ratio of the total amount of dividends paid out to shareholders relative to the net income of the company. In other words, it is the percentage of earnings paid to shareholders as dividends:
DIVIDEND PAYOUT RATIO = DIVIDENDS PAID / NET INCOME
If a company’s dividend payout ratio is over 100%, it means it is returning more money to the shareholders that it is earning. Obviously, that is not sustainable situation and company will probably be forced to lower dividends in the future.
For example, in 2022 Apranga Group (APG1L) paid record dividends – almost 28M Eur (company didn’t pay dividends since COVID-19 pandemic and, accordingly, accumulated huge amount of cash):
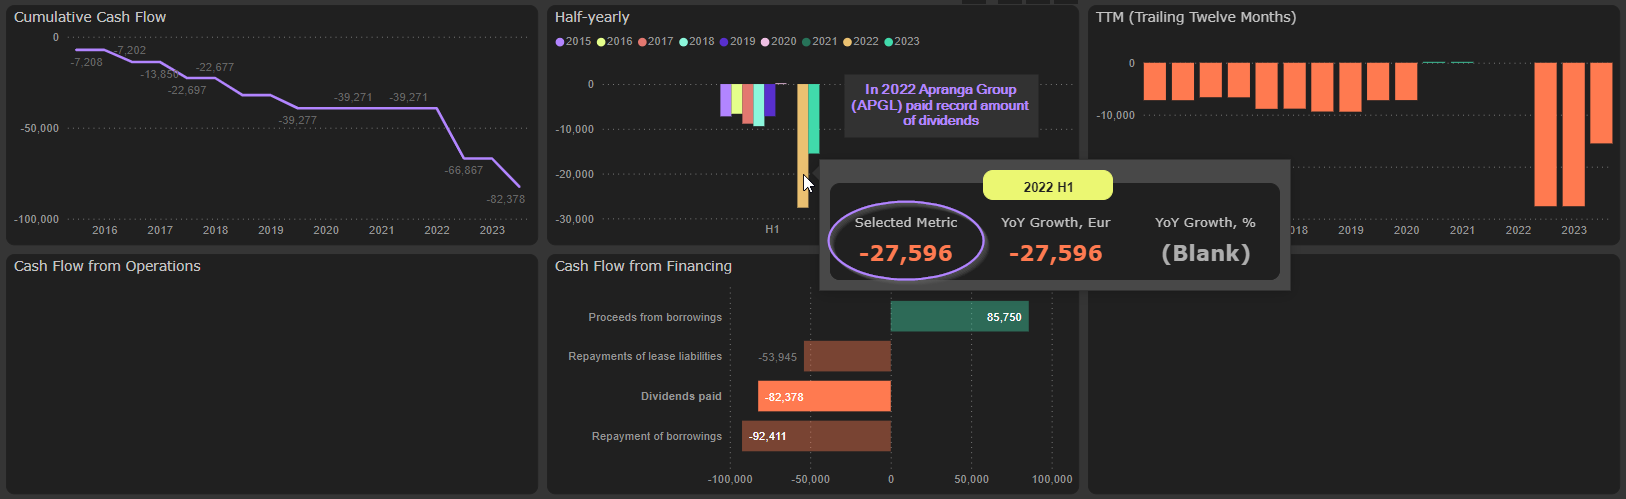
Company’s TTM net income in 2022 H1 was 15,6M Eur. Accordingly, dividend payout ratio jumped to almost 200%. Dividend yield shoot up to over 25%:
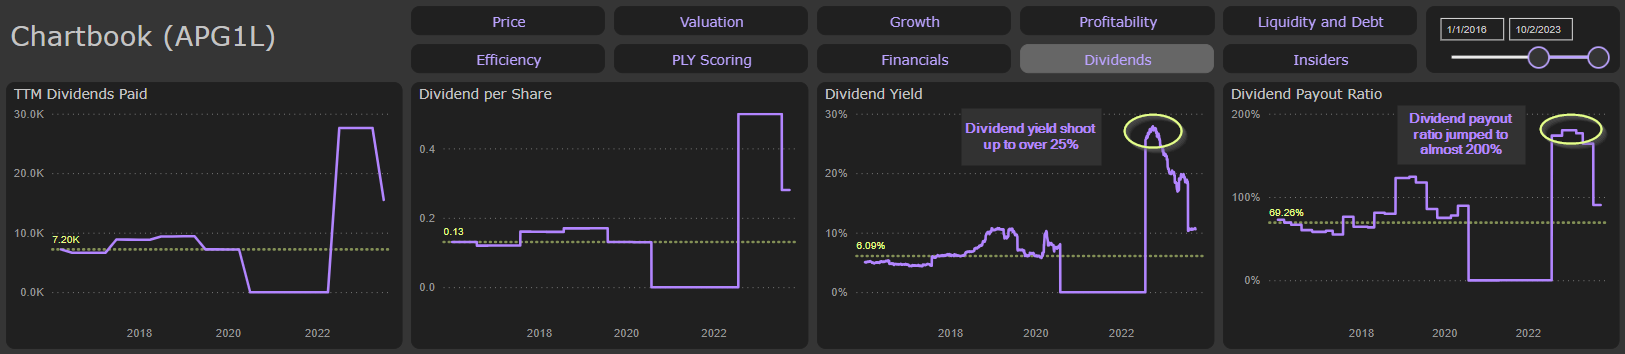
Obviously, that was not sustainable situation. In 2023 Q2 Apranga group reduced its dividends to 15,5M, dividend payout ratio decreased to much more sustainable 90% and dividend yield fell to 10% (still very high level).
Ability to pay the dividends
However, the most important factor is company’s ability to pay the dividends. To pay the dividends a company needs to have cash. Not the profits, but cash. A company can generate cash from its operations, which after necessary capital expenditures (CapEx) is available for shareholders and creditors. Or borrow. Obviously, to borrow money to pay the dividends is not the best way to ensure sustainable dividend policy, although it could be used sometimes. So, the necessary condition for sustainable dividend policy is stable and positive free cash flow (cash flow from operations – CapEx). Continuously weaker or even negative free cash flow will lead eventually to lower dividends. Or it may eliminate company’s ability to pay dividends altogether.
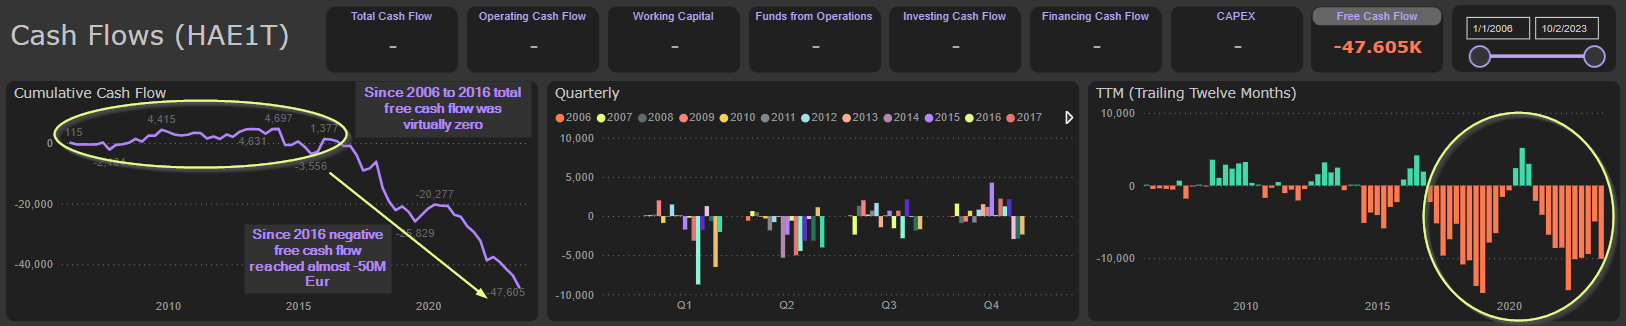
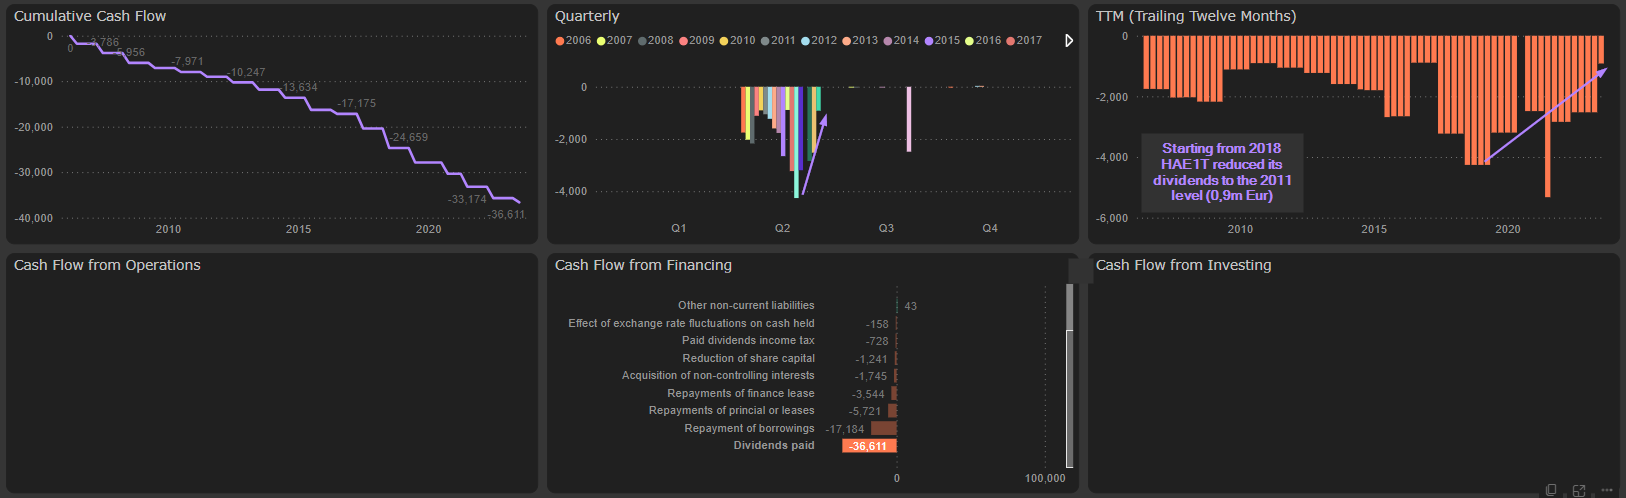
Since 2006 to 2016 Harju Elekter (HAE1T) has generated virtually no free cash flow, although earned net income during this period reached 43M Eur. Since 2016 free cash flow became strongly negative: total free cash flow during this period reached almost -50M Eur (total net income during this period was 37M Eur):
Till 2018 company maintained its dividend policy and continuously increased paid dividends from 1M Eur in 2011 to 4,2M Eur in 2018:
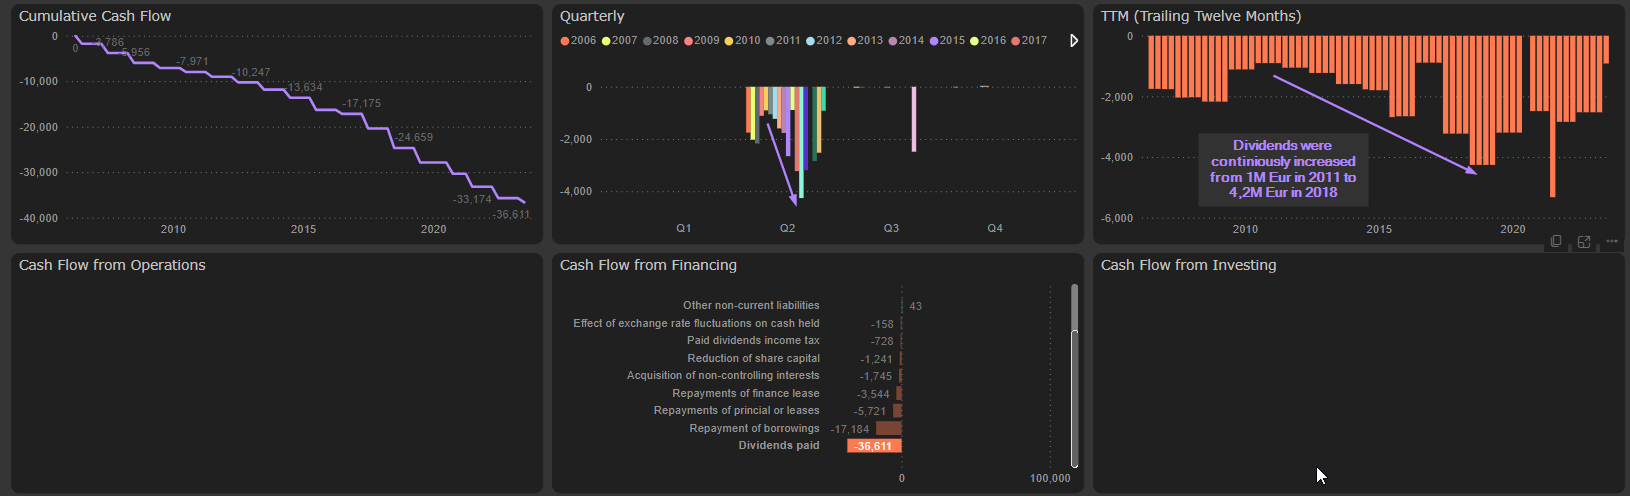
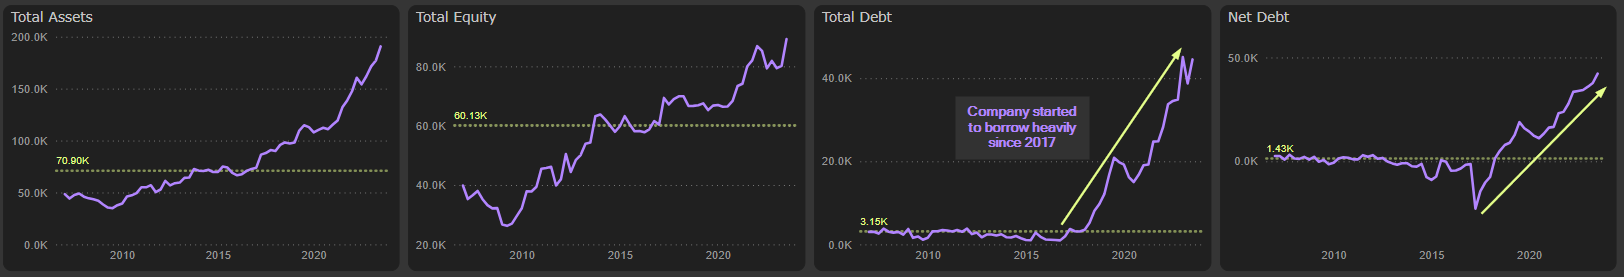
Even when, due to strongly negative free cash flow, company started to borrow heavily since 2017:
However, starting from 2018 financial “gravity” is finally catching on: company slashed its dividends several times, reducing it to the 2011 level (0,9M Eur):
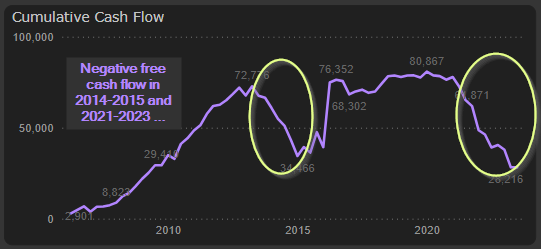
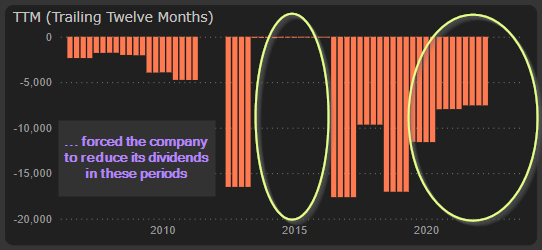
Very similar situation was experienced by Klaipėdos nafta (KNF1L) in 2014-2015 and 2021-2023 periods: negative free cash flow forced the company to reduce its dividends:
Don’t let the high visible dividend yield to mislead yourself. Check the consistency of dividend policy, dividend payout ratios and company’s ability to maintain stable or rising dividend payments. Get dividend investing right.