Apranga Group (APG1L)
Is the shopping spree over?
In the aftermath of COVID craziness Apranga Group was “sitting on the cash pile” of 37M Eur. With only about 100M Eur Market Cap. Since then, it has generated 25M Eur of free cash flow (after lease payments), distributed 43M Eur to shareholders as dividends and its share price rose almost 50%. Despite such impressive performance Apranga Group shares still offer value.
Shop till the drop
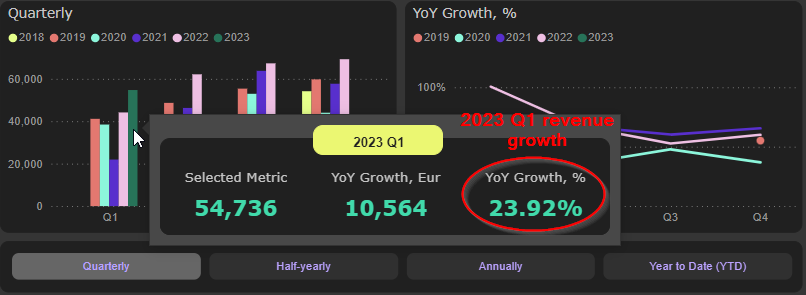
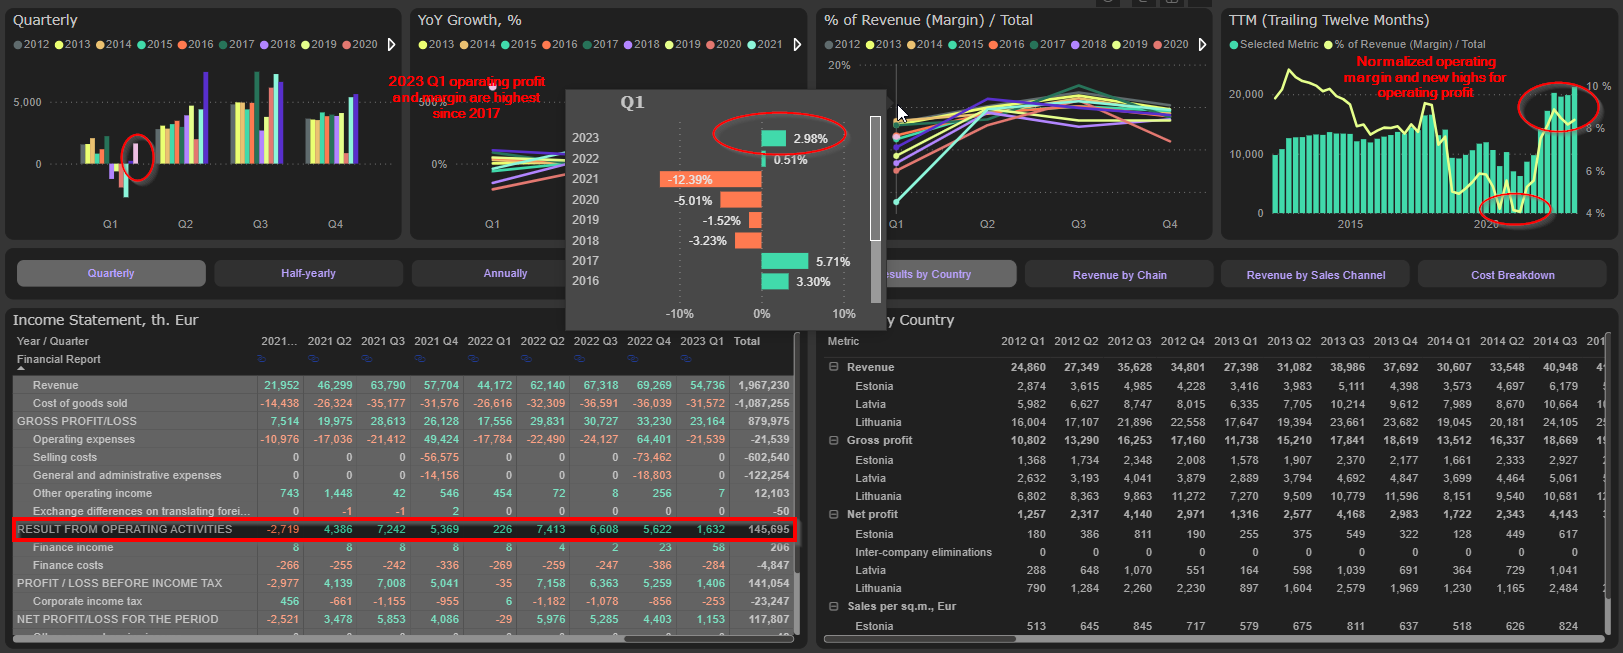
2023 Q1 revenue set the new record growing by 23,9% YoY. That was only slightly slower compared to 2022 FY revenue growth (+28% YoY):

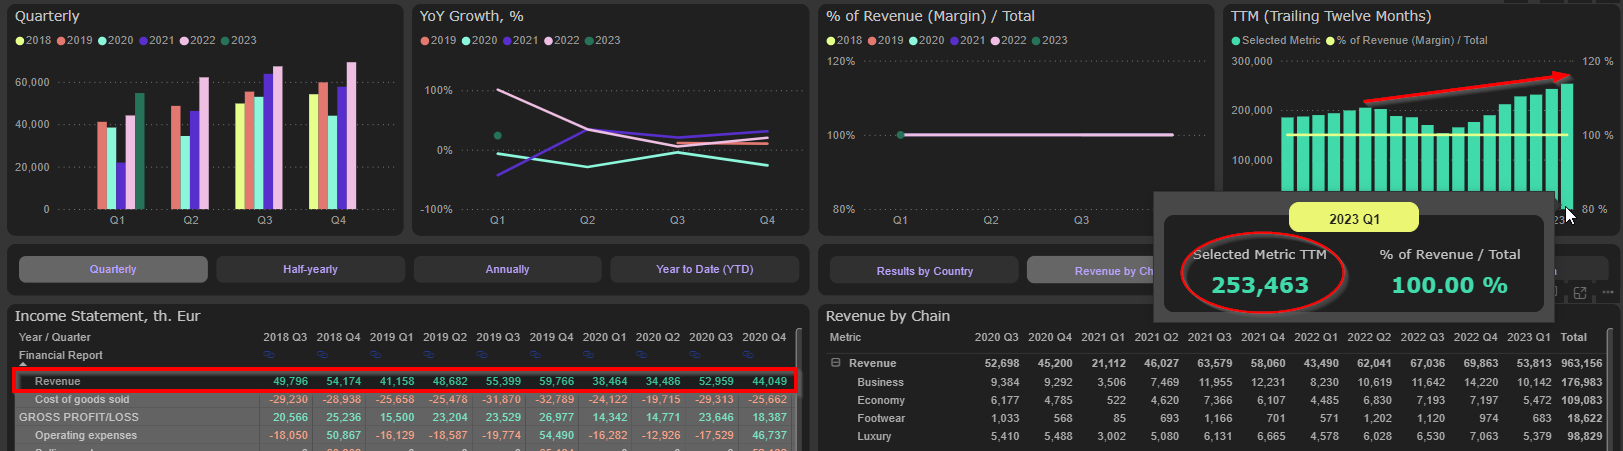
Pre-COVID TTM revenue level (2019 Q4) is exceeded already by 24%:
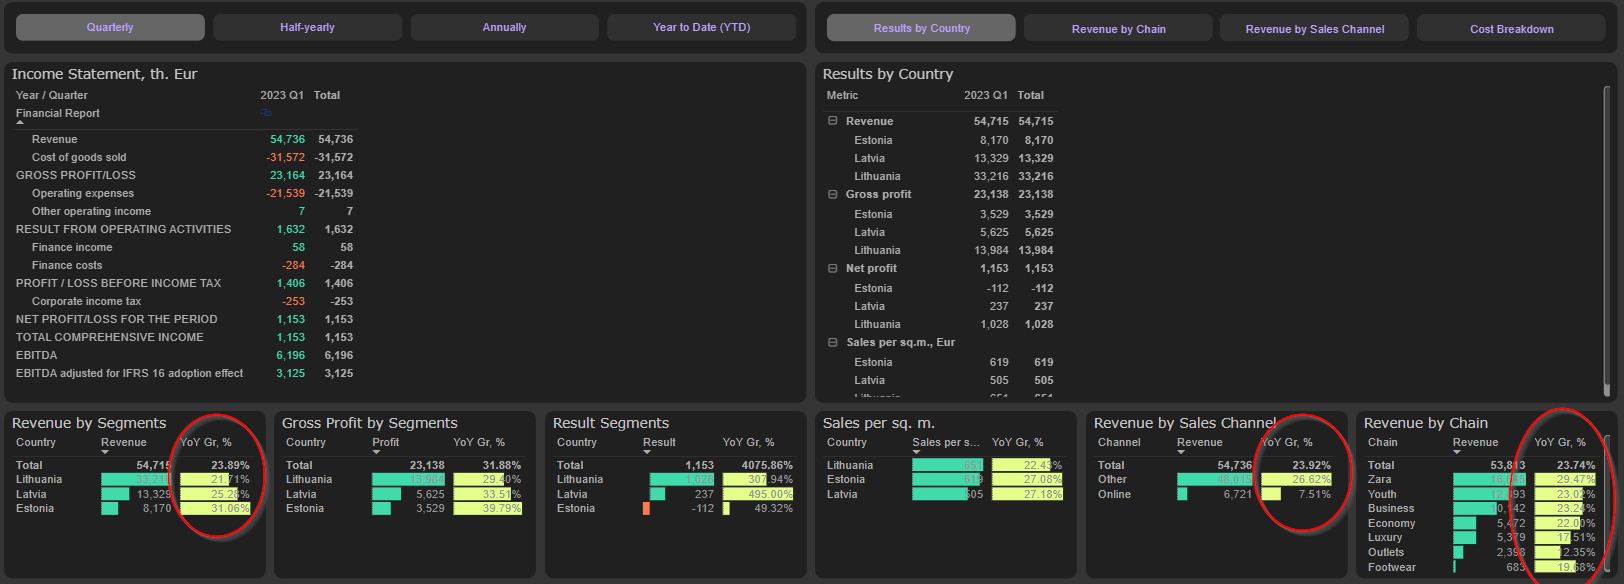
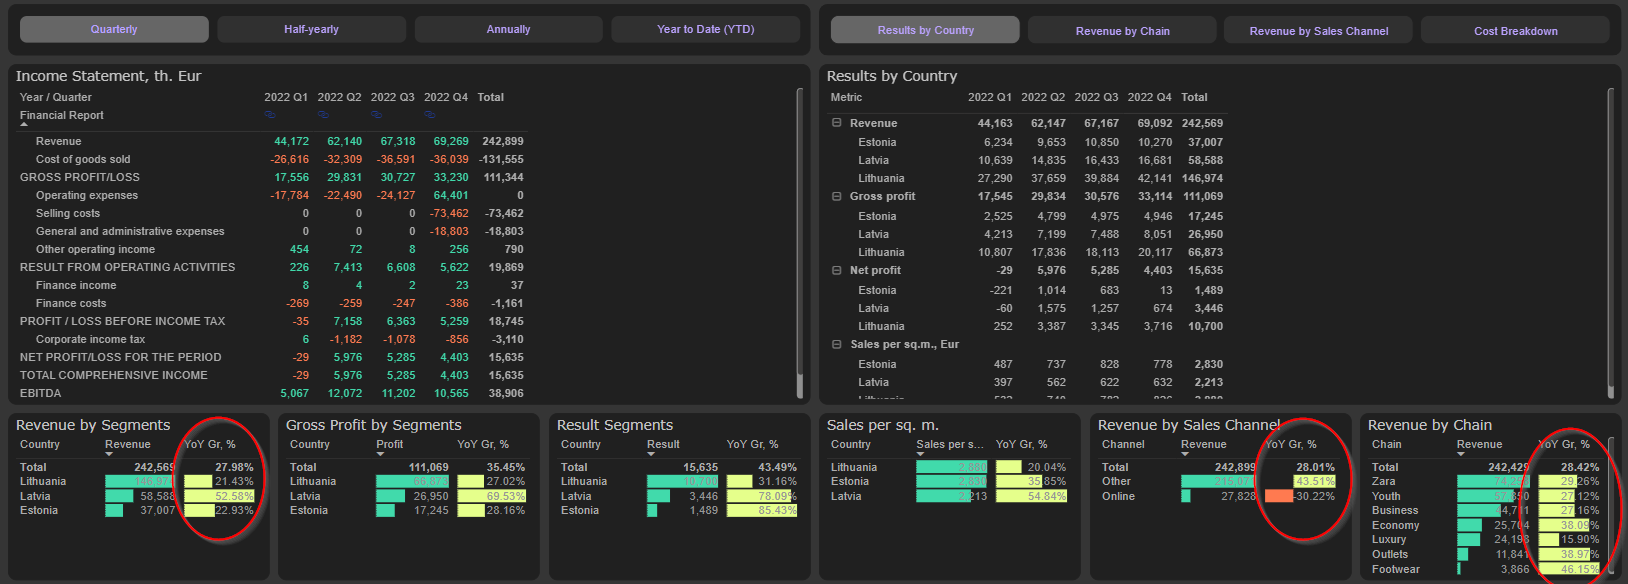
2023 Q1 revenue growth was driven mostly by Group’s “flagship” Zara as well as Youth, Business and Economy chains. Latvian and Estonian markets grew slightly faster than Lithuanian, although growth is very healthy in all countries. The structure of main growth drivers was essentially the same in 2022.
Main growth factors in 2023 Q1:
Main growth factors in 2022 FY:
TTM revenue of all Group’s chains are exceeding their pre-COVID level, except of Footwear. Recovery of Footwear is very sluggish. Number of stores is continuously decreasing, annual revenue per store is only 396K Eur and lower than in 2019. It seems that Footwear may face “extinction” destiny, as it was in Tallinna Kaubamaja two years ago (Tallinna Kaubamaja "merged" its Footwear segment into Departmen store segment in 2021):
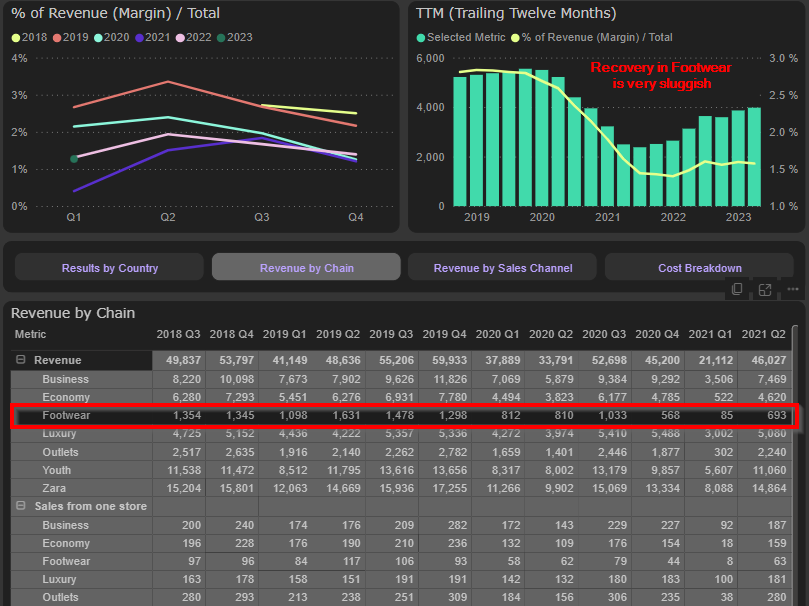

However, ending the experiment with footwear market is not necessarily bad for Group’s bottom line. Considering Footwear’s average revenue per store (approximately 400K Eur/year or 33,5K Eur/month), this segment may operate on the verge of profitability or even below break-even. ~33,5K Eur/month/store with average gross margin (46,15%) gives only ~ 15,5K Eur/month/store of gross profit. Rent and salaries may easily wipe-out this tiny gross profit per store.
Company is closing also rapidly stores in Economy segment, however that is compensated by very strong growth in revenue per store:

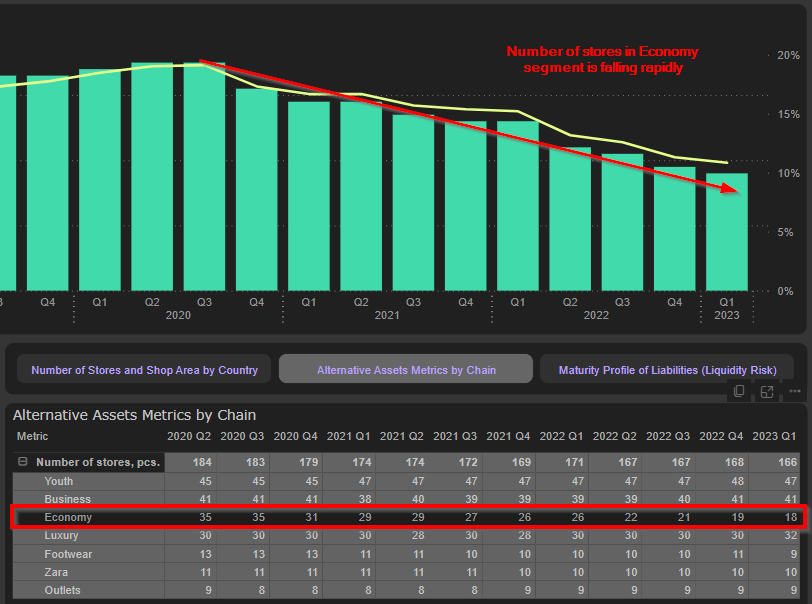
Strong growth in Group’s revenue is associated by continuous decrease in total retail space (as well as number of sores). That means Apranga is still able to “squeeze” more sales from one square meter and store. That means more efficiency, of course.
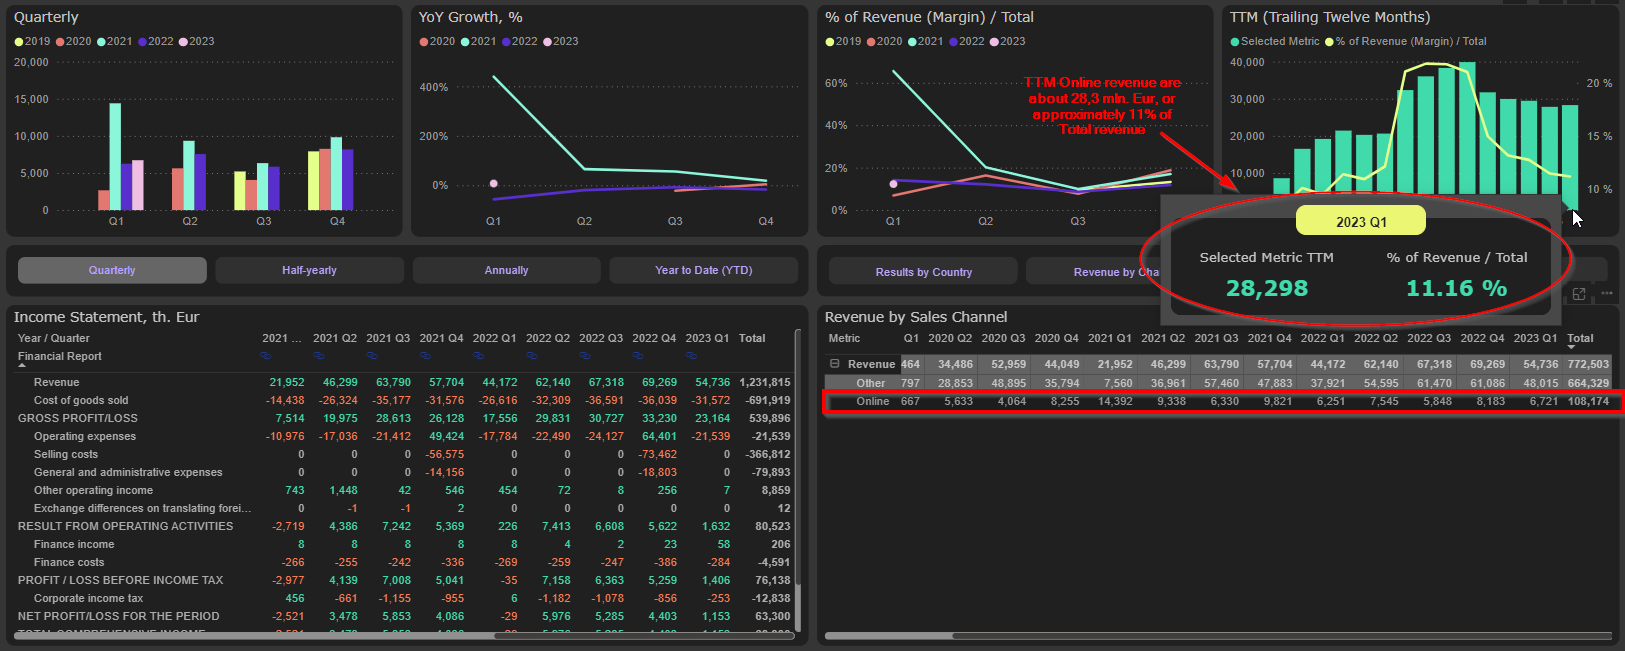
2023 Q1 TTM sales per square meter reached 3.000 Eur in Lithuania, 2.962 Eur in Estonia and 2.321 Eur in Latvia. These numbers, however, are impacted by Group’s online revenue, which comprised about 11% of total sales (decrease from ~21% in 2021):
Excluding online revenue, average TTM sales per square meter are about 2.474 Eur. Strategically, there is a lot of room to go. E.g., Inditex global sales per square meter (excluding online) are about 5.300 Eur. H&M is not disclosing its total retail space, so calculations of its sales per square meter are somewhat complicated. However, its average annual sales per store are about 30% lower compared to Inditex - 3,1M Eur vs 4,6M Eur of Inditex (btw, Group’s average TTM sales per store are 1,35M Eur). It would be reasonable to assume, that H&M average sales per square meter also are about 30% lower compared to Inditex, amounting to approximately 3.700 Eur. That leaves also a lot of space for growth.
The look from another angle also bodes quite well for Group’s long-term sales growth per space unit. Average revenue per square meter of retail space in the Western Europe clothing retail sector is about 3.500 Eur. That is about 40% higher than actual Group’s number and this gap probably will be narrowing.
And finally – online. It seems that Group’s “brick-and-mortar” sales proved to be far more resistant to online disruption as it was feared. Group’s online sales surged to ~40M Eur (21% of total sales) in 2021 due to lockdowns and then declined gradually to current ~28M Eur (~11% of total sales). Current share of online sales is significantly lower compared to e.g. H&M (30%) and Inditex (26%). That looks more like opportunity than threat.
It’s all about margins
However, real Group’s achievement in last two years was dramatic improvement in margins. After six years of continuous decline, gross margin has rocketed from 41,9% to 46,1% in last two years. 2023 Q1 gross margin was near record highs:
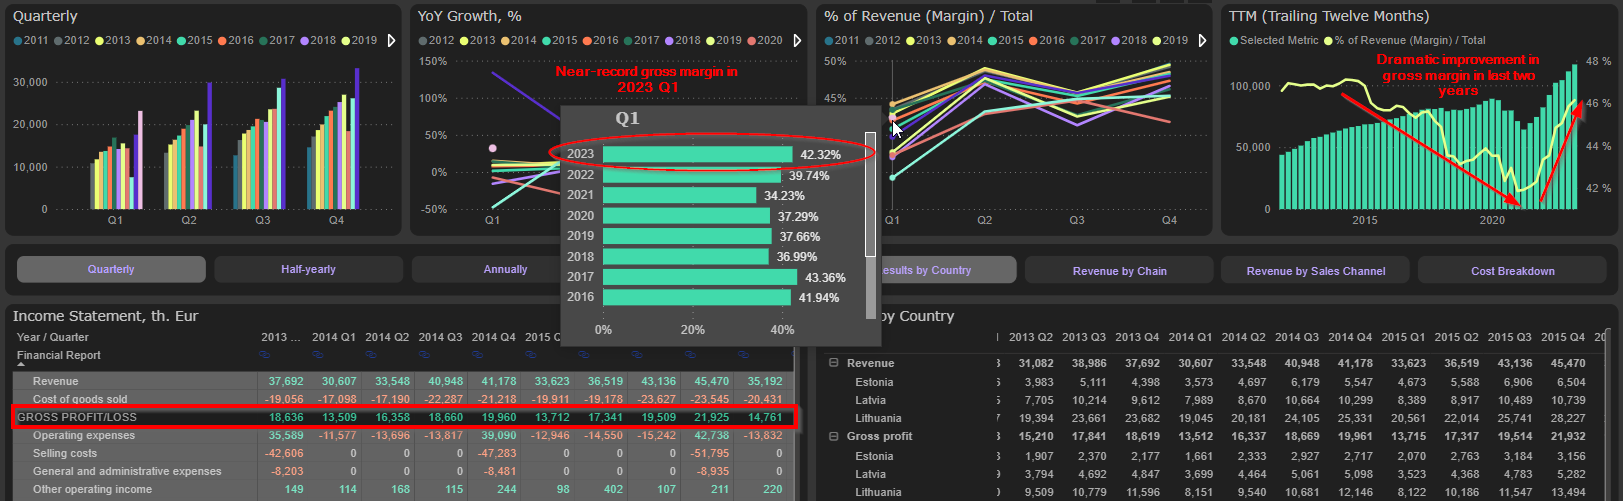
In 2022 FY report Company has briefly explained, that improvement in gross margin was “mainly driven by more effective inventory management”. Actually, it is confirmed by record inventory turnover, which hit all time low at 115 days in the middle of 2022 and has remained at this level since then. That means potentially less discounts for customers and more sustainable gross margin for investors:

Recovery in operating margin was even stronger – from 4,1% at the 2021 Q1 bottom to 8,4% at the end of 2023 Q1. Additional (though marginal) improvement came from good OpEx control – OpEx ratio to revenue was 37,9% at the end of 2023 Q1, while average level for 2016 – 2021 was slightly above 38%. In essence, operating margin recovered to its normal level of 8,0-8,5%. Coupled with increased revenue that gives us above 20M Eur of annual operating profit:
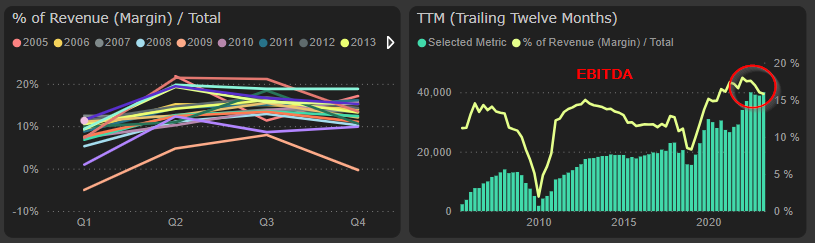
Annual EBITDA reached 40M Eur level with approx. 16% margin. More comparable metric – EBITDA adjusted for IFRS 16 adoption effect (excluding rent payments) – reached 28,5M Eur with approx. 11%. EBITDA margin also recovered to its normalized levels during last 20 years:

That can’t last forever
Of course, the party can’t last forever. It’s just not possible to grow sustainably by 20%+ a year in Baltic apparel market. Margins also have their natural limits. Early signs are already here. Group is reporting its monthly sales numbers. According to disclosed information, in April sales grew by 13,8% YoY, in May – 9,8% YoY, in June – 6,5%. In 2023 Q2 sales grew 9,8%. The trend is very clear.
We assume cautiously (but, probably – reasonably), that 2023 Q3 and Q4 sales will actually decline YoY. Our base case assumption is that 2023 FY sales will reach 250M Eur. That means +3% YoY growth for 2023 FY and -7% YoY decline for 2023 2H. Value investing is advising cautiousness all the time and we are following this advice.
Then we are working down to obtain our assumptions for 2023 FY profits and margins:
- Revenue – 250M Eur (+2,9% YoY)
- Gross margin – 46% (current TTM level – 46,1%, 2022 level – 45,84%)
- Gross profit – 115M Eur (+3,3% YoY)
- Operating expenses – 96M Eur (+4,1% YoY)
- Operating profit – 19M (-4,4% YoY)
- Operating margin – 7,6% (current TTM level – 8,39%, 2022 level – 8,18%)
- EBITDA (after lease payments) – 25M Eur (-7,6% YoY)
- EBITDA margin – 10,0% (current TTM level – 11,15%, 2022 level – 11,14%)
These conservative (we believe) assumptions give us first indications about Group’s valuation.
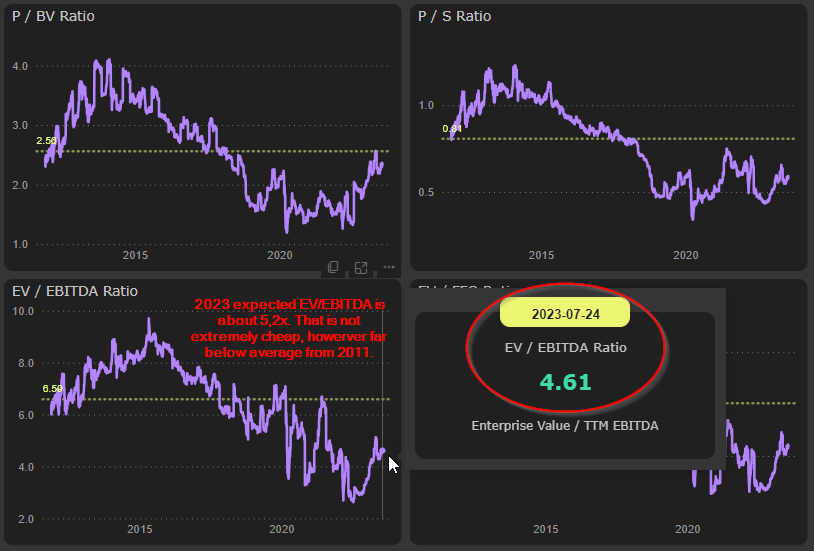
Current Enterprise value (excluding lease liabilities) is about 130M Eur. With 25M Eur expected EBITDA that gives us 5,2x EV/EBITDA. Of course, that is far from extreme bargain levels of 2022, but still looks very attractive in the context of historical valuation as well as peers and market:

However, the real story of Apranga Group (actually, as well as of any other company) is about cash flows.
“Revenue is vanity, profit is sanity, but cash is king”
If it would be possible to reduce entire investment analysis to one metric, it would be undoubtedly free cash flow. And its price in the market. Essentially all practical applications of corporate finance and investment analysis, from trivial debt and dividend payment to sophisticated DCF models, are based on free cash flow. From this perspective Apranga Group is really extraordinary achiever.
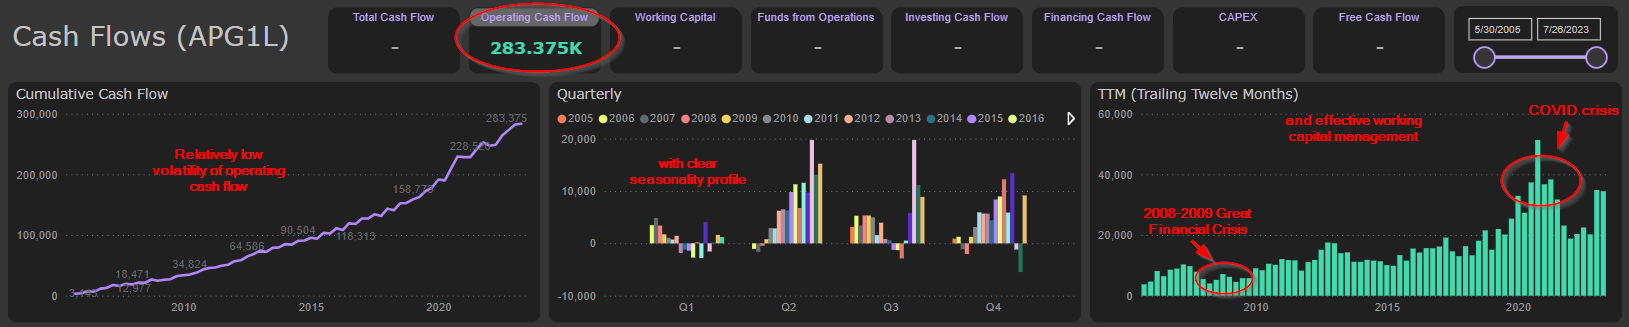
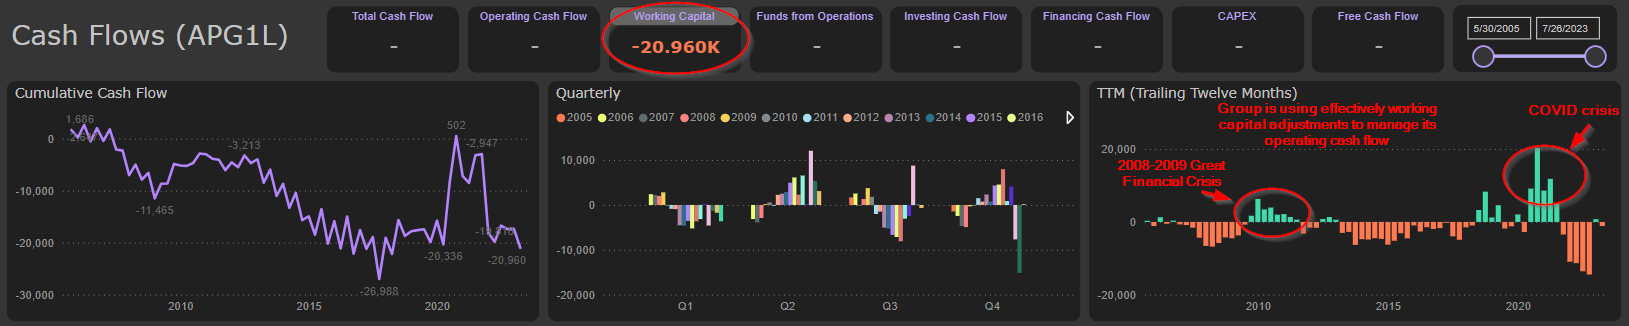
Group is generating stable and growing cash flow from operations with relatively low volatility. Cyclical lows are effectively managing by working capital adjustments:
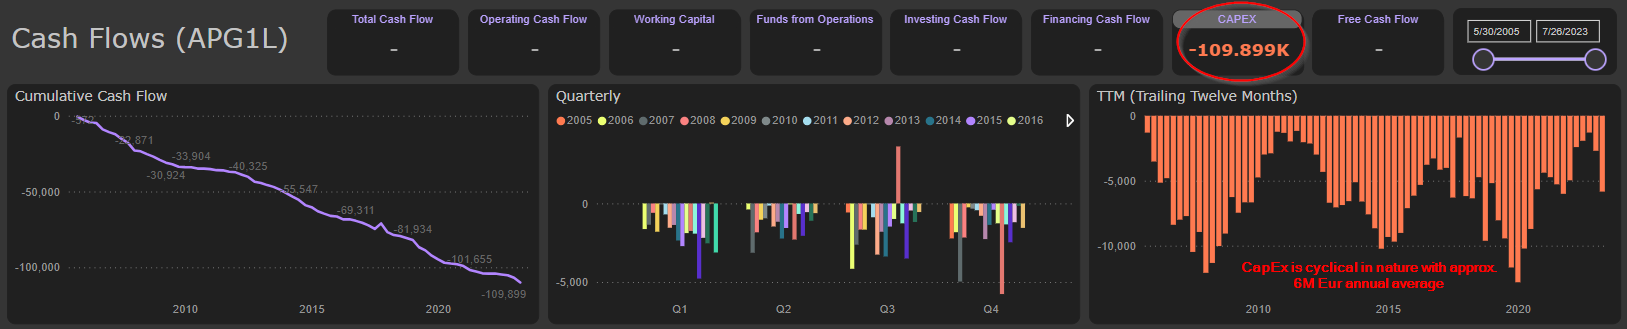
Capital Expenditures (CapEx) are cyclical in nature and averages to about 6M per year. Maintenance (replacement) CapEx, required to maintain stable fixed assets base, is about 5,8M year. For our free cash flow estimations we assume 5,8M of annual CapEx:
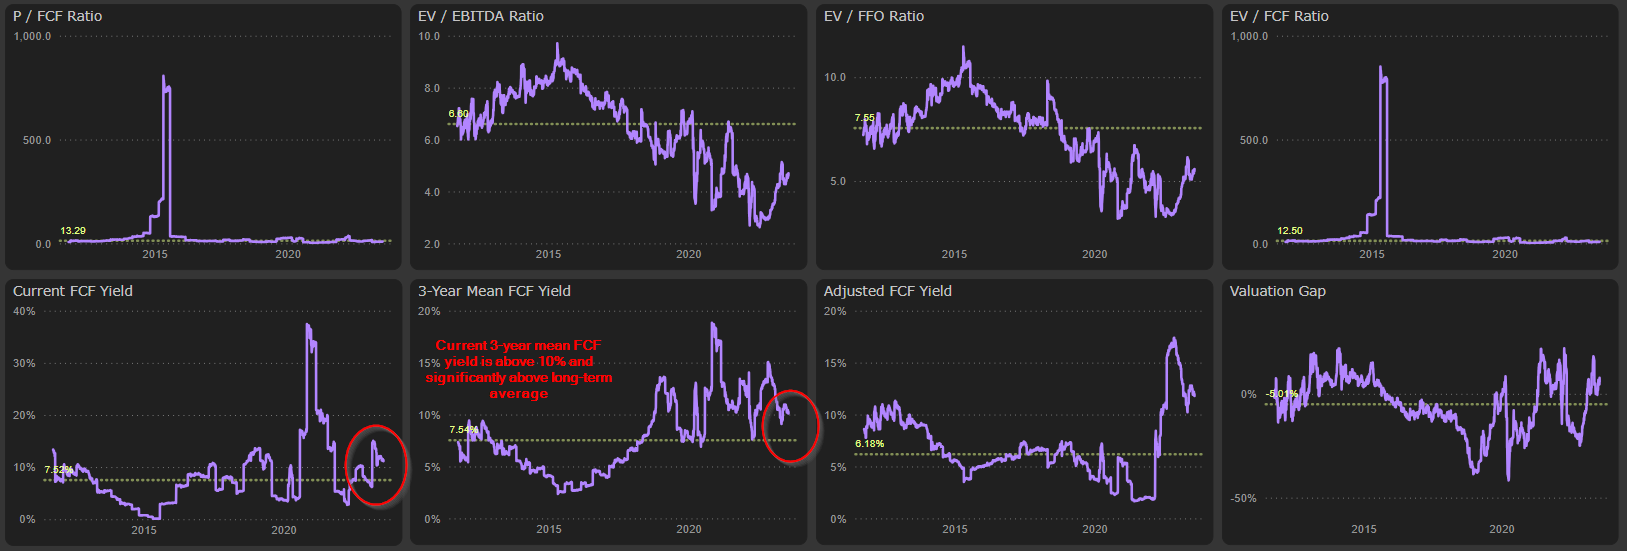
In our calculations of free cash flow we include also payments of lease (rent) liabilities, which is really essential element for Group’s business model. That allows to maintain comparability and reflect better the nature of these payments. Actual TTM free cash flow (FCF) is 16,9M Eur. Averages for last 3 and 5 years are respectively 15,2M and 12,1M Eur. With actual 150M Eur Market Cap that gives us impressive 10-11% FCF yield (already far from recent highs, however significantly above long-term average):
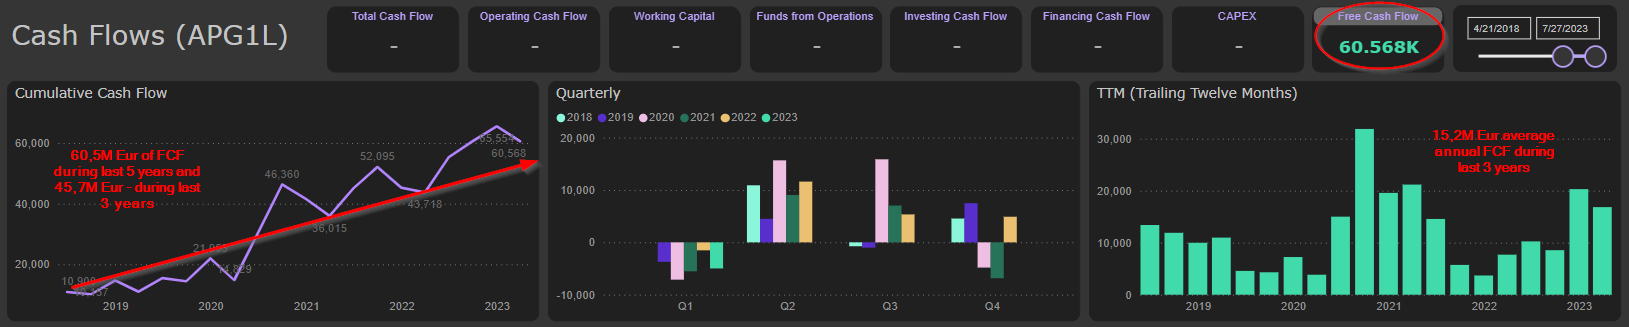
Our cautious estimation of 2023 FY FCF is about 15M Eur (with assumptions of 5,8M Eur CapEx and no change in working capital).
Just for reminder: Group has no debt (excluding lease liabilities), so entire FCF is available for distribution to shareholders (dividends). Alternative path could be expansion through M&A activities or organic growth, however it’s not very likely in Baltic markets. Respectively, we expect that current policy of FCF distribution to shareholders will be continued. That gives us (still) very healthy expected dividend yield north of 10%.
No free lunch
Of course, we can’t leave an uncomplete picture of Apranga Group’s investment case and not to mention most important risk factors. As history teaches us, a lot can go wrong. It would be reasonable therefore to learn from history and prepare ourselves not only for returns, but also for risks. Below we mention some, but obviously not all essential risk factors.
Macroeconomic shocks. Obviously, we are much more likely in the late stage of business cycle, than early. That is really crucial for Consumer cyclical sector. Sales growth is already slowing down significantly. Negative YoY dynamic in 2023 H2 is almost certain, in our opinion. Interest rate environment doesn’t need more comments and obviously is doing what FED and ECB intend it should do – slowing down consumer demand. The only question is not “if” we will have a recession, but “when” we will have it and “how deep” it will be. Of course, in our estimations we assume decrease in sales, profits and FCF. However, it is far from stress test scenario.
On the other hand, we should not forget that Group entered previous crisis (2008-2009 Global Financial Crisis) with 200M Eur Market cap, 220M Eur Enterprise value and only 13M Eur EBITDA. Today that is 150M Market cap, 130M Eur EV and 28M EBITDA company. It is significantly leaner, stronger and cheaper version of Apranga Group.
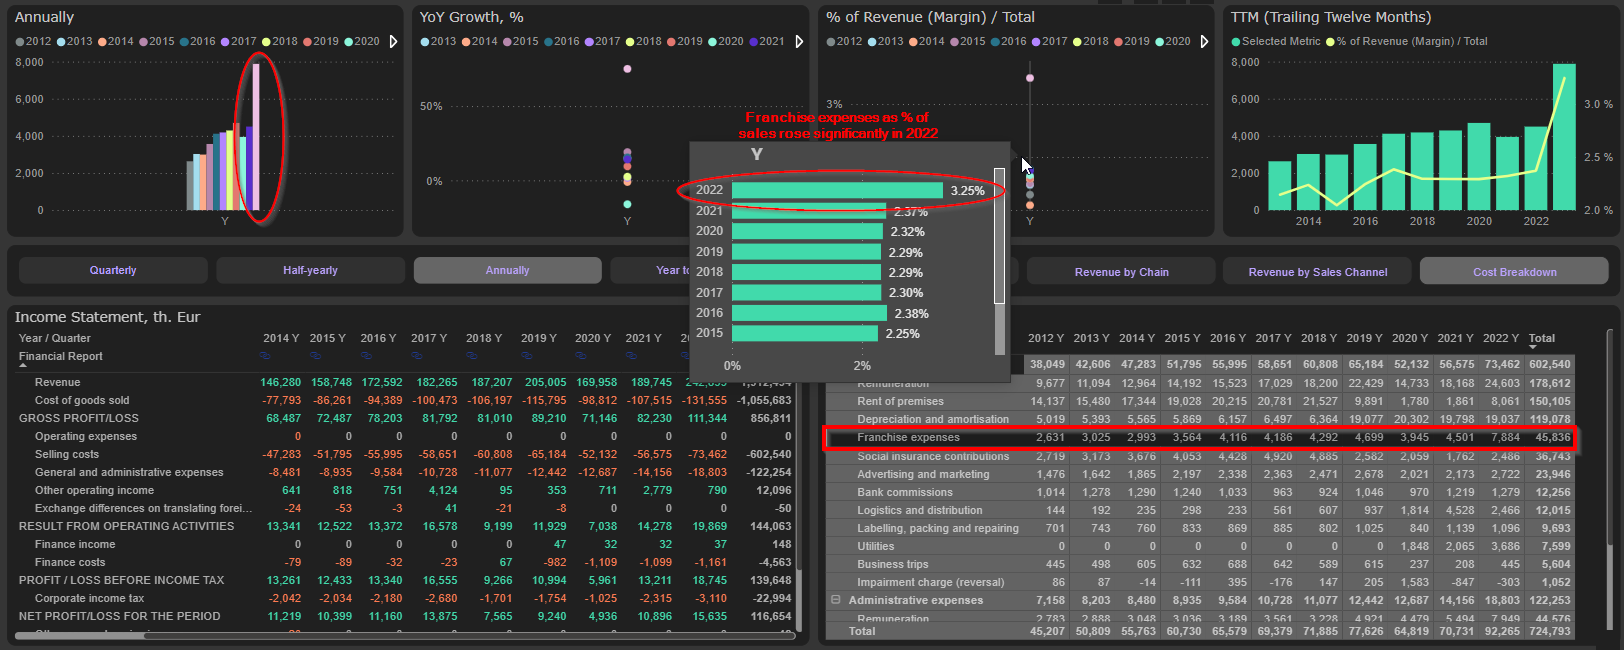
Business model risks. 43,9K sq. m. (48%) of Group’s total retail space are committed to brands under franchise agreement with Inditex. In terms of revenue it is, probably, significantly more, because only Zara accounts for 31% of total revenue (+ Bershka, Pull and Bear, Stradivarius, Massimo Dutti, Zara home and Oysho brands, which are not excluded to separate segments to identify precise amount of sales). Apranga Group renewed its agreement with Inditex (7th time) in March 2022 for two years (till 2024). Considering long history of cooperation between Group and Inditex, the risk of not renewing the agreement 8th and subsequent times is very remote, though not non-existent. Moreover, Apranga Group has issued to Inditex the call options to acquire lease rights for Zara, Bershka, Pull and Bear, Stradivarius, Massimo Dutti, Zara home and Oysho stores. Group’s management believes that these options will not be exercised (as it was in the past). However, again, the risk is not non-existent. Finally, even the extension of cooperation does not immune the Group from Inditex pricing risk. E.g., in 2022 franchise fee rose significantly – from average 2,3% of revenue to 3,25% of revenue:
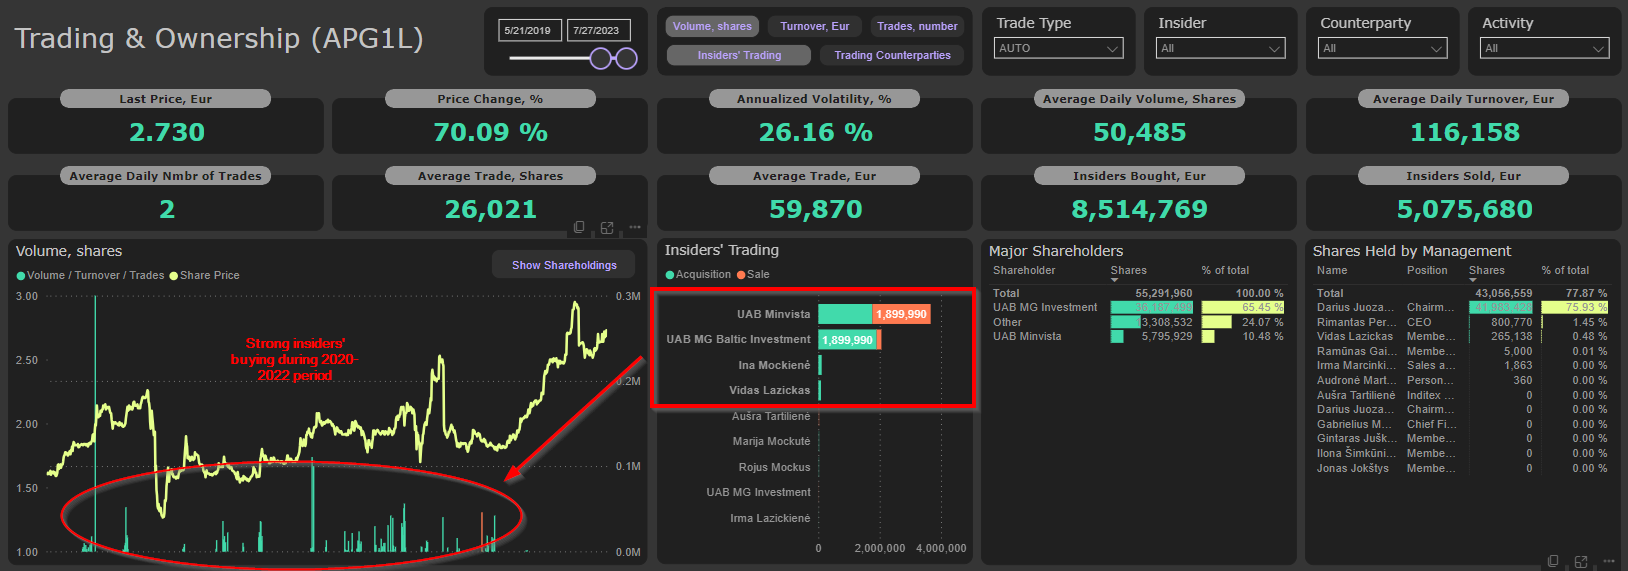
Shareholders risks. Main shareholders (UAB MG Baltic investments and UAB Minvista), which are related parties, and persons related with them are buying actively shares in the open market (especially strong insiders’ activity was at depressed valuation level from 2020 to the end of 2022):
Shareholdings of two main (related) shareholders are constantly growing:

From the perspective of share price, it is obviously very positive factor. However, this consistency in increasing shareholdings of main shareholders could indicate higher risk (though quite remote) of potential delisting in the future.