How to see quarterly, half-yearly, annual and YTD data
In our Profitability, Cash flow and Assets & Liabilities analytics you can easily switch data format to quarterly, half-yearly, annually or YTD format. Just press the corresponding button:
Or select from the drop-down menu in Cash flow analytics:
Possibility to change data format can significantly enhance your analytical and data comparison capabilities. E.g., you can easily see and compare YoY dynamic for quarterly, half-yearly and YTD data:
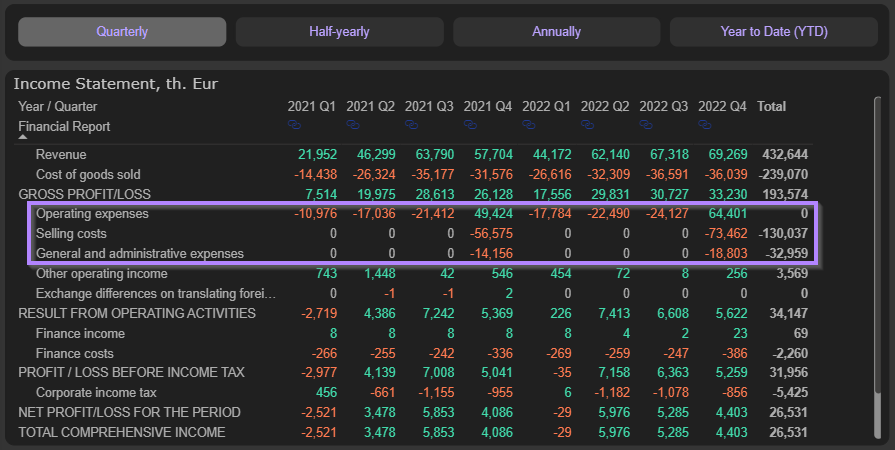
With data format switching you can have also better understanding of structural changes between company’s annual and quarterly reporting. E.g., below you can see the difference between quarterly and annual cost structures:
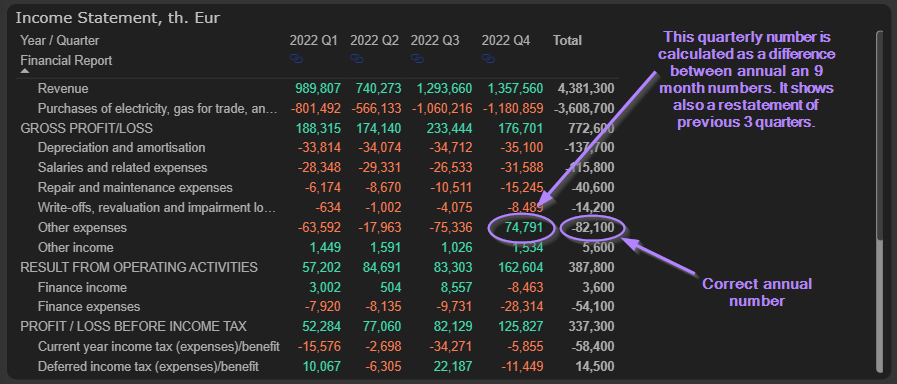
Quarterly numbers in our analytics are calculated as a difference between two respective YTD periods. That means that e.g., Q3 numbers are calculated as a difference between reported 9 months and 6 months numbers. That approach guarantees correct YTD and TTM numbers and allows to recognize cases of restatements within the same year or potential accounting / reporting errors:
If some analytics, e.g., Cost breakdown, are not available with the quarterly data format:
That may mean that these numbers are reported by company only on annual or half-yearly level. Try to change data format and numbers should appear:


