Increase efficiency of your analysis with multiple selection functionality
You can significantly increase the efficiency of your analysis by using multiple selection functionality of our dashboards. View profitability, balance sheet and cash flow metrics from completely new angles and with additional dimensions.
Market and Expert dashboards
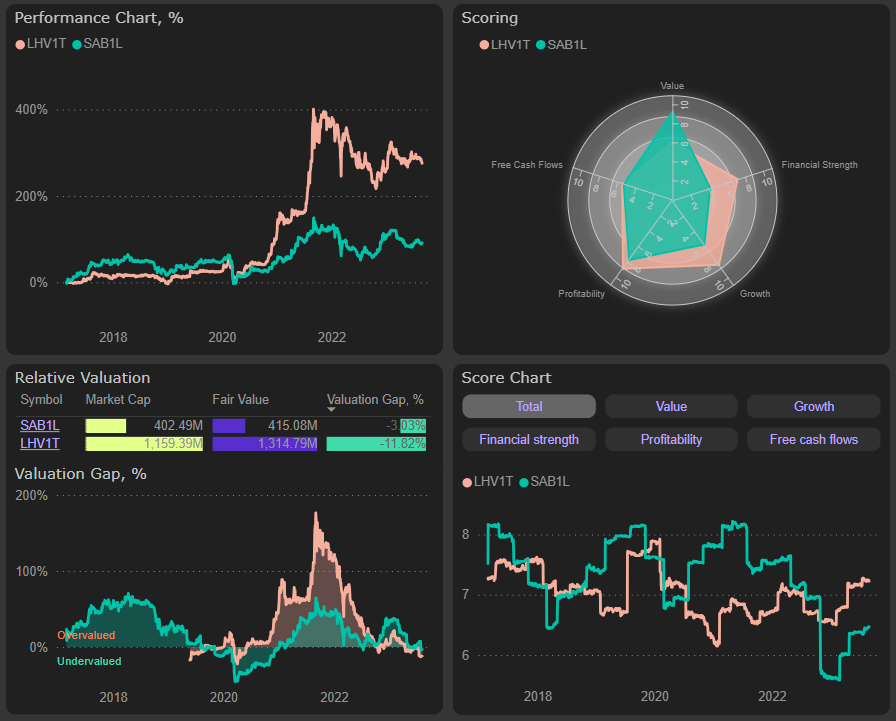
First of all, you can select multiple companies and easily compare them by any metric you wish. Press the “Ctrl” key and select the companies you wish to compare. Our market dashboard allows to evaluate and compare companies quickly by their Scores, assigned by our Scoring algorithm, and Valuation gap:
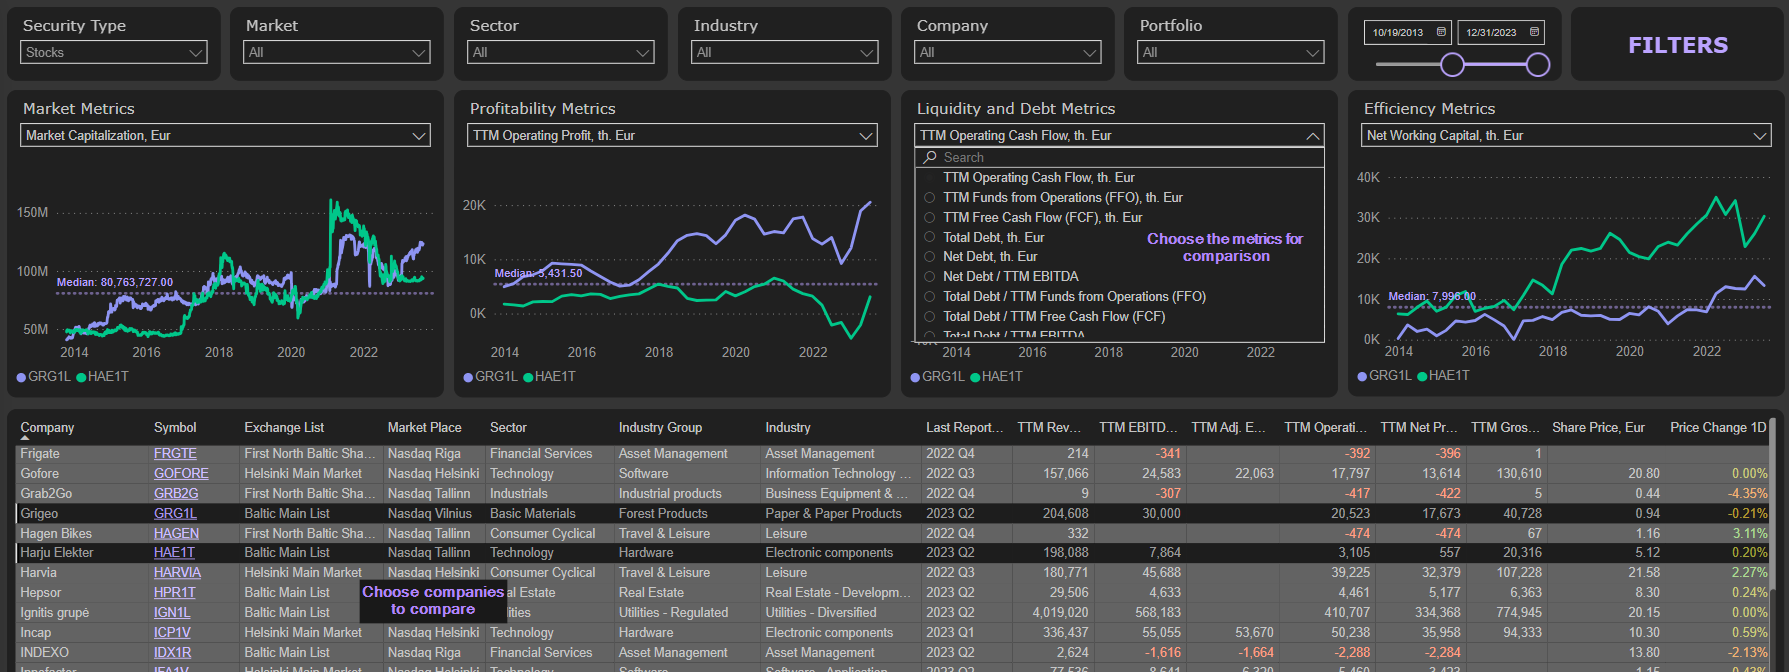
In the Expert dashboard you can choose multiple companies with “Ctrl” key and use any from dozens financial metrics to compare them:
Profitability, Segments and KPIs analytics
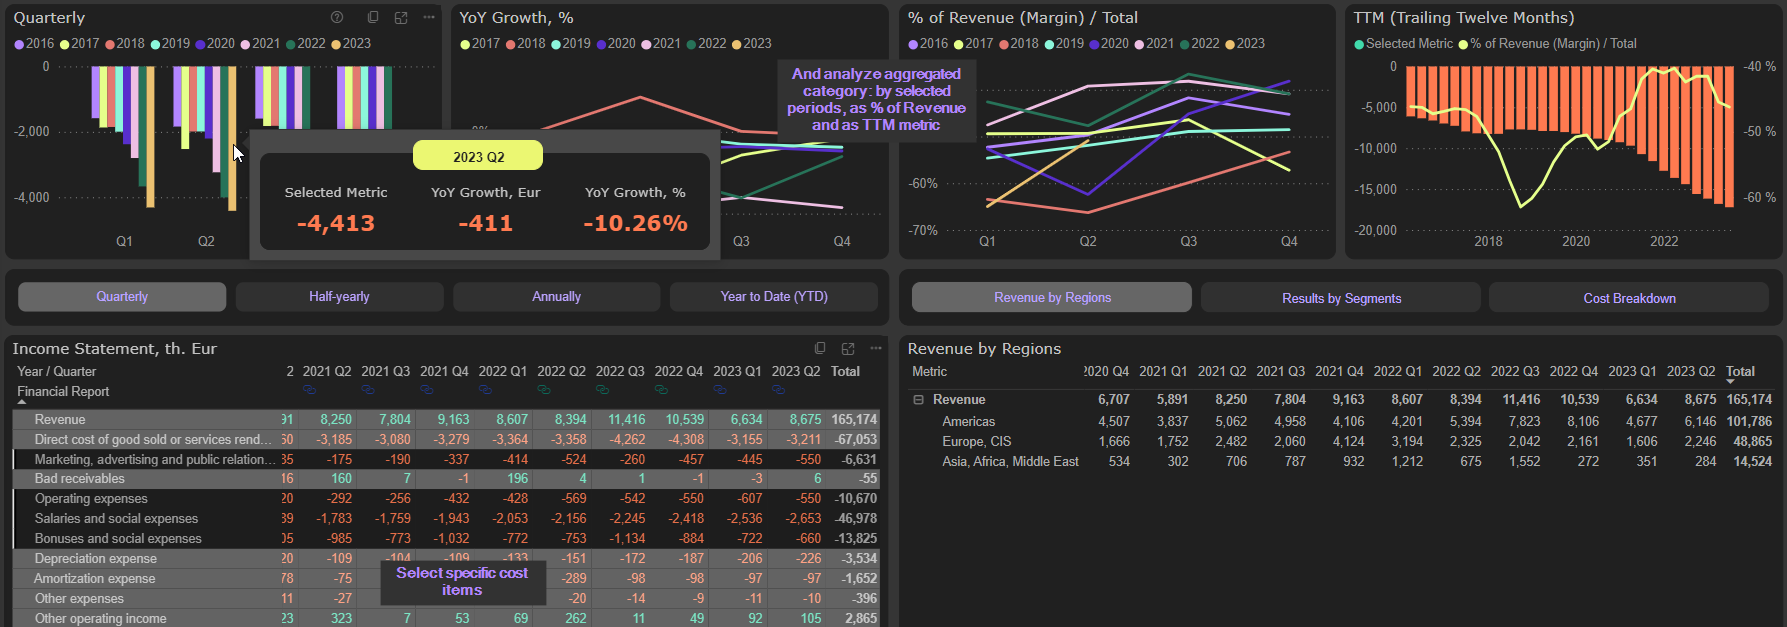
In every table of Profitability, Segments and KPIs analytics you can select multiples items with “Ctrl” key. That will add these items together and show the total in the charts above. E.g., you can select Revenue and Direct cost of goods sold items from the Income statement and see the automatically calculated total as a Direct gross profit category, even if the company didn’t provide it:
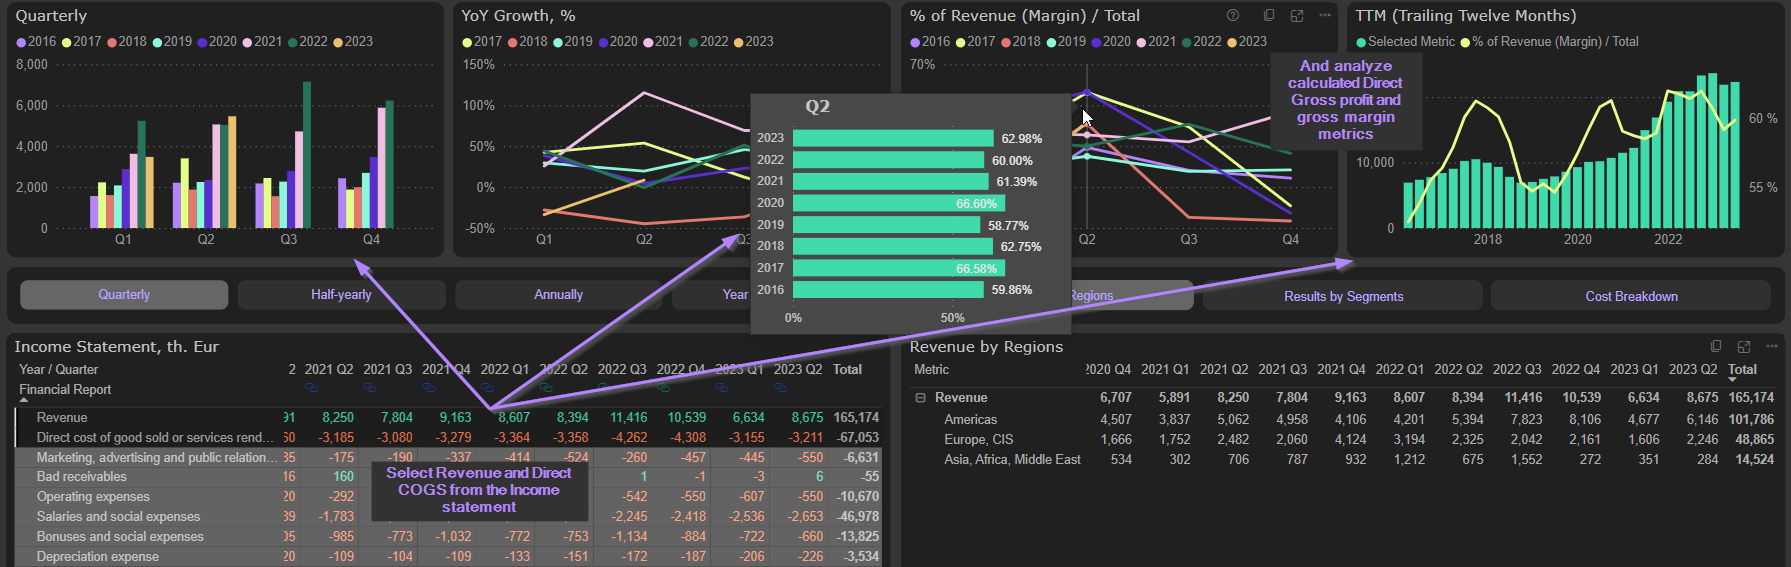
Or you can select several items of expenses from the Income statement and analyze the dynamic of this total category, including Quarterly / Half-yearly / Annually / YTD numbers, YoY growth, relation to Revenue and TTM metric:
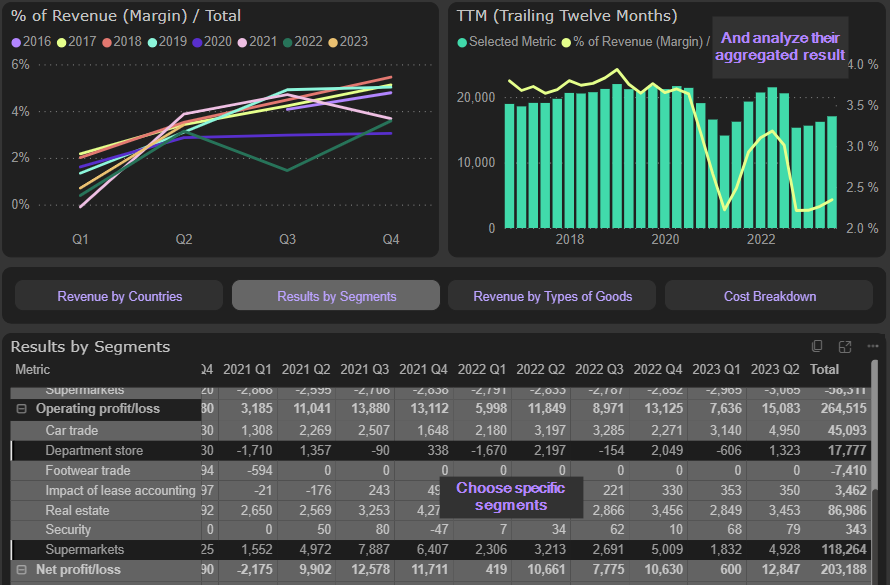
You can also add together several segments and analyze their total results graphically. Or you can add together several items from the Cost breakdown table and analyze dynamic of this category, including its relation to Revenue:

Assets & Liabilities analytics
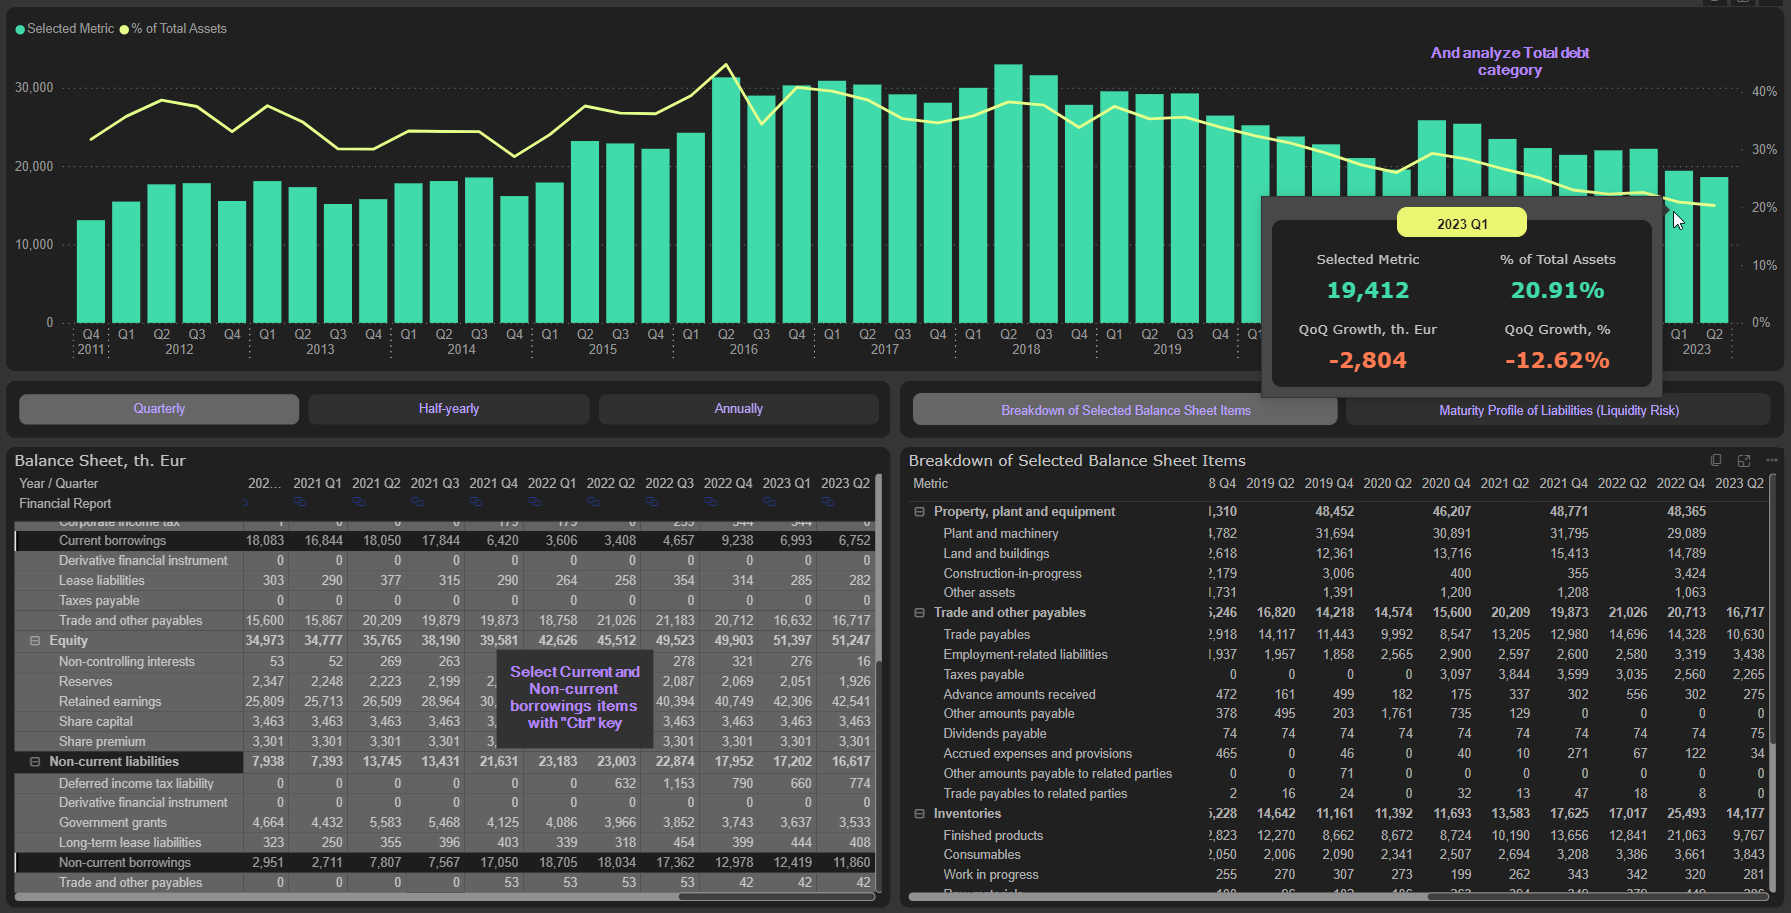
Multiple selection of Balance sheet items with “Ctrl” key allows to add them together and analyze total category graphically. E.g., selecting of Current and Non-current debt items from the Balance sheet allows to add these items together and analyze the dynamic of Total debt:
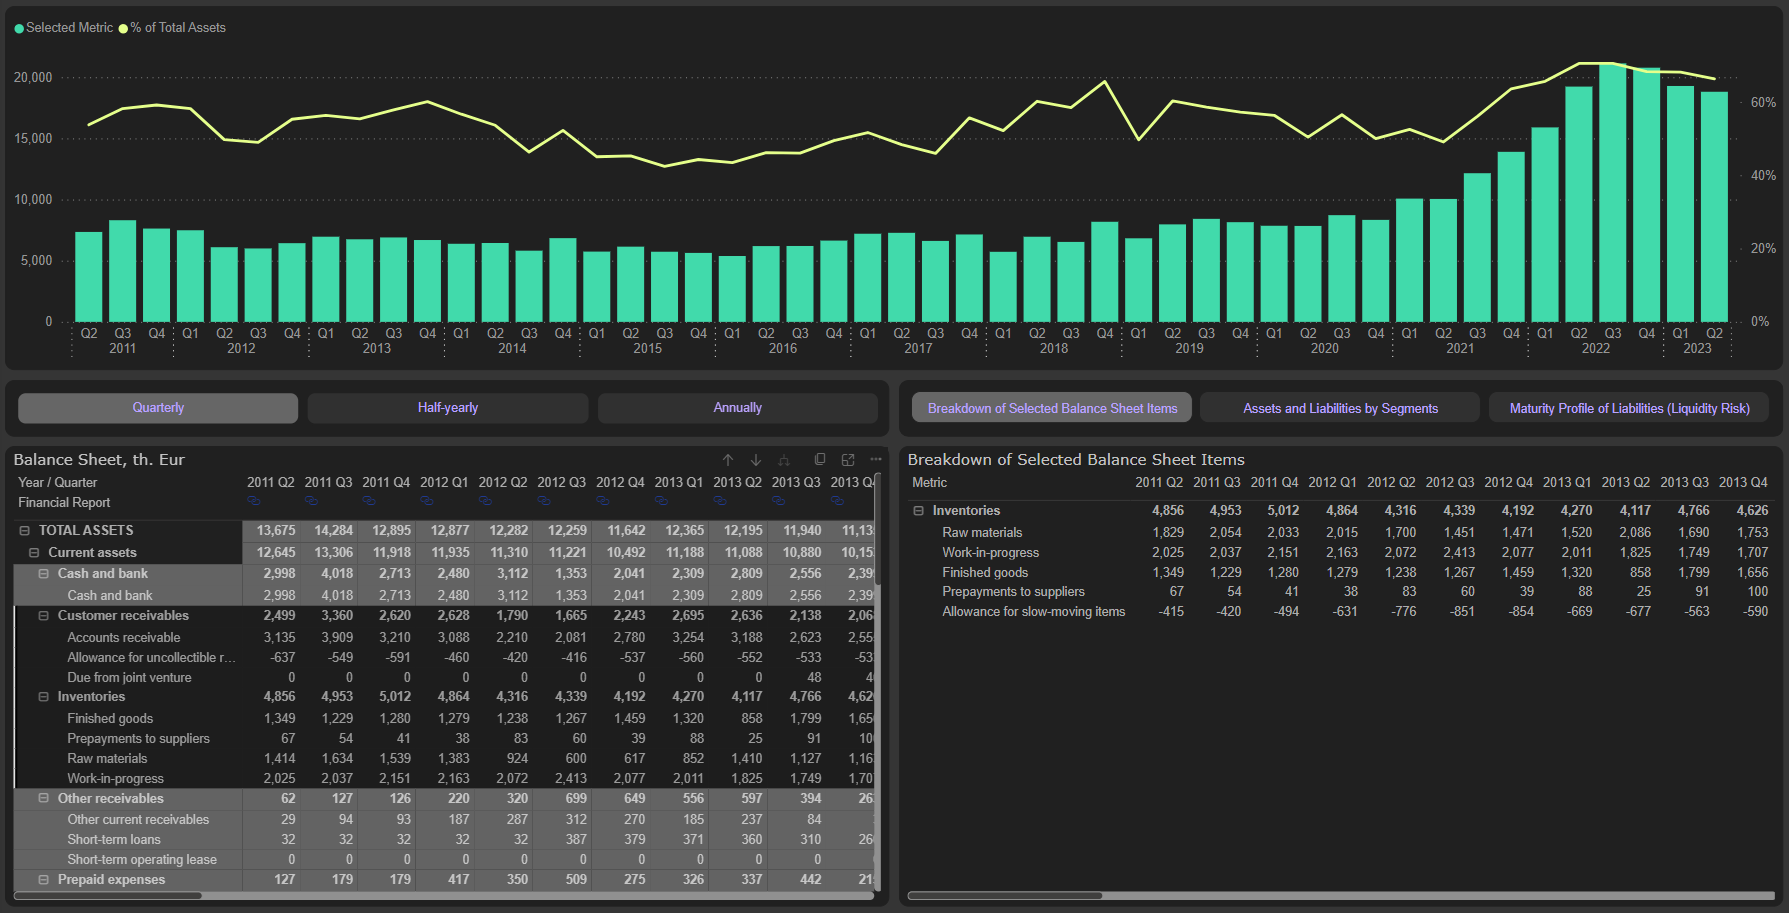
Or add together Inventories and Trade receivables and analyze graphically this element of Working capital:
Cash flow analytics
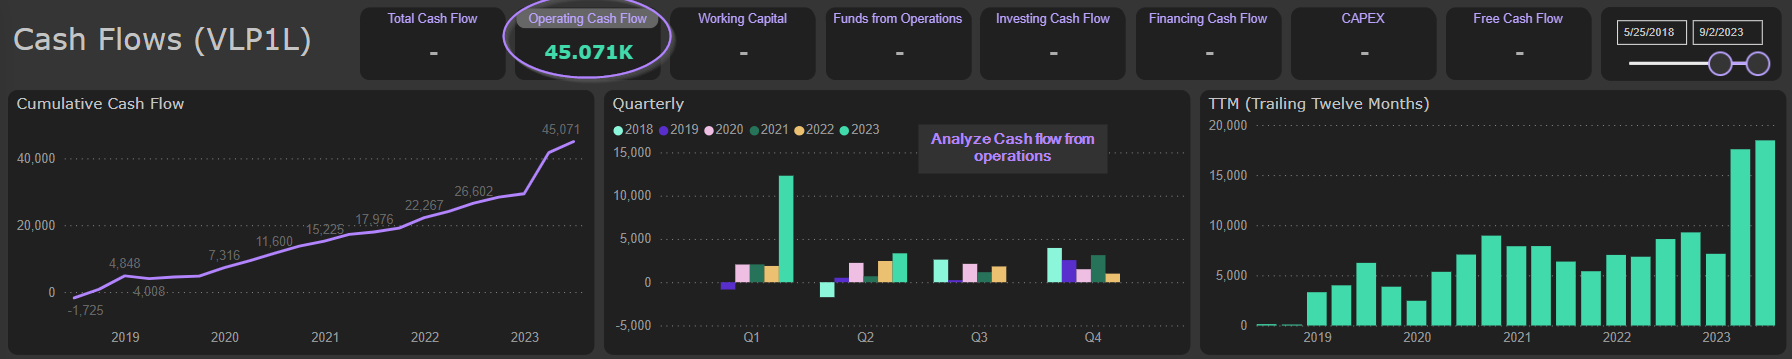
Multiple selection of Cash flow items allows to increase dramatically productivity of your cash flow analysis. You can view cash flows from completely new angles and with additional dimensions.
First of all, excluding Working capital items from the Operating cash flow allows you to analyze quickly and effectively Funds from operations, one of the most important metrics of cash flows. We have even created specific buttons to separate and compare these metrics quickly and effectively:

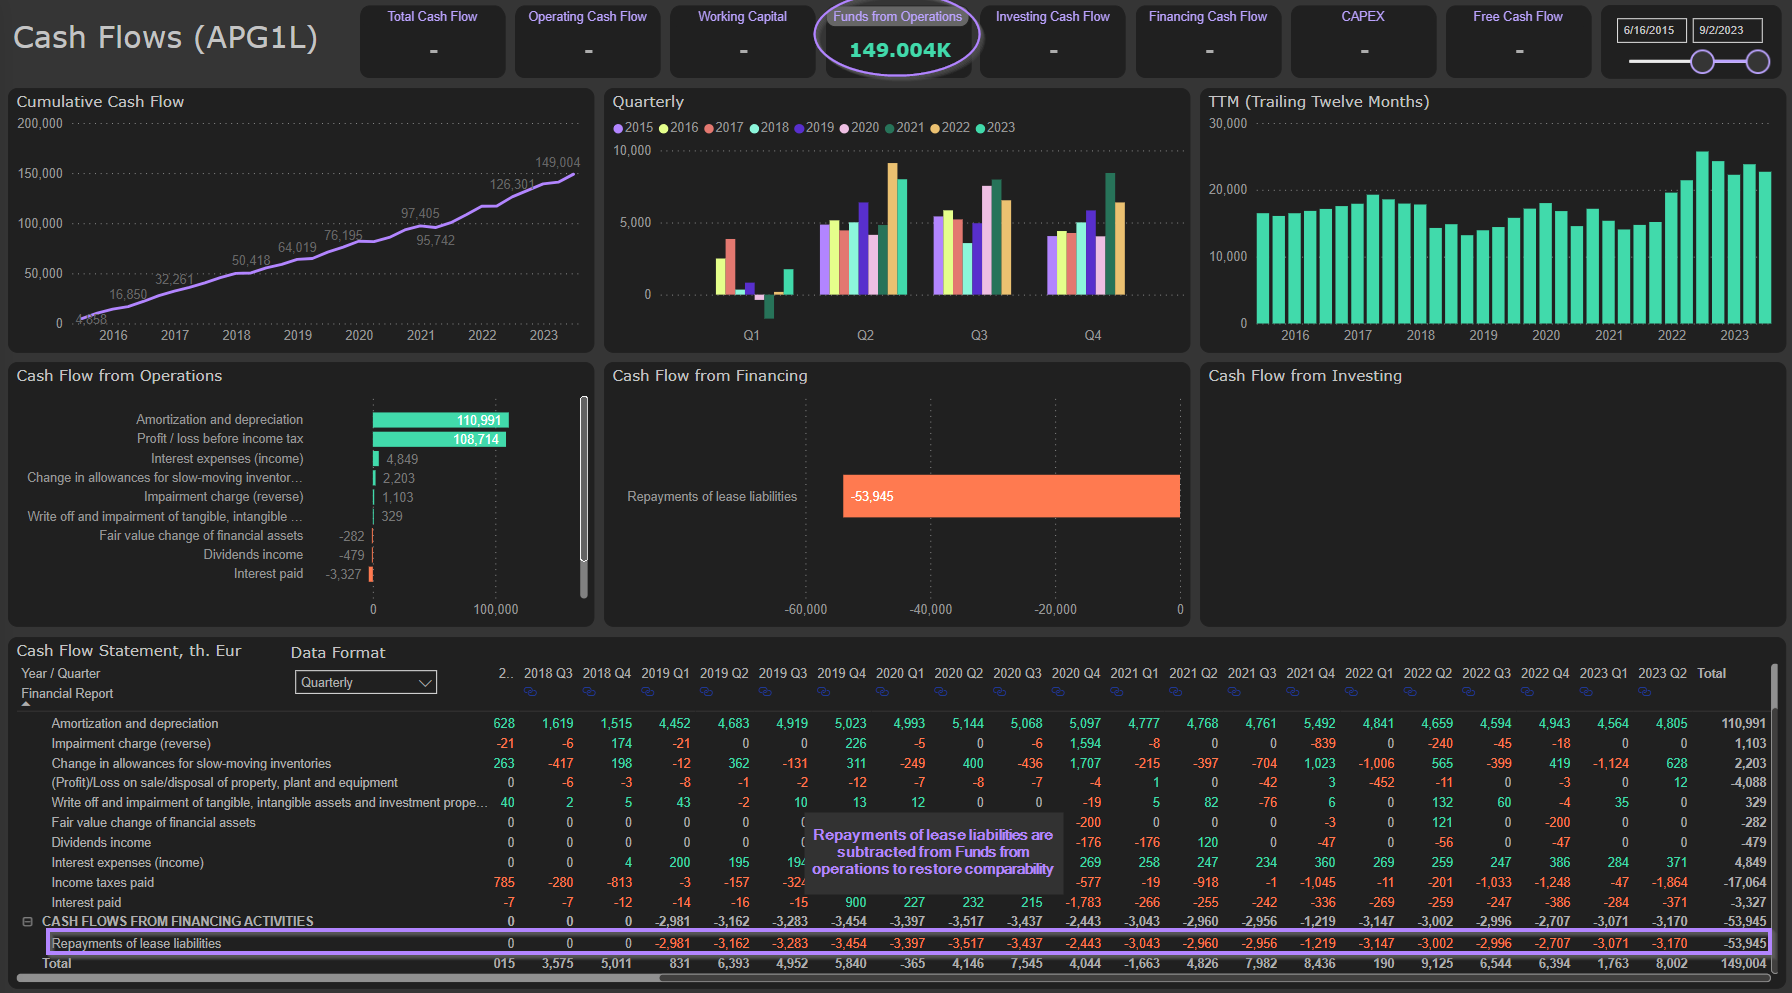
Further, you can subtract lease payments from Funds from operations to restore cash flow comparability after 2019 IFRS 16 change and reflect cash flow from operations in more correct way. We have done that already by including lease payments into Funds from operations metric. You need just to press the right button:
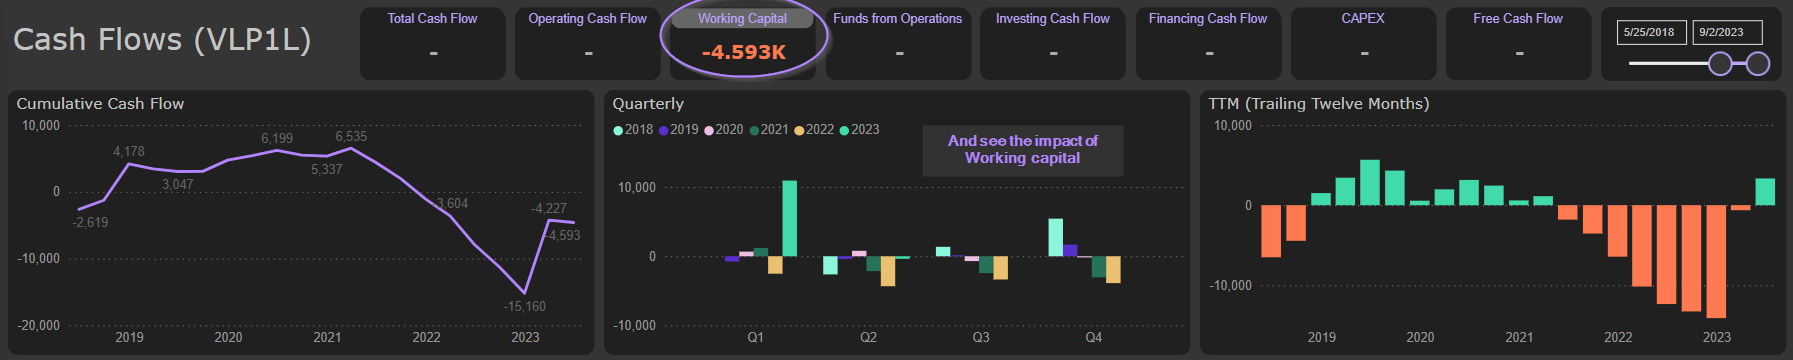
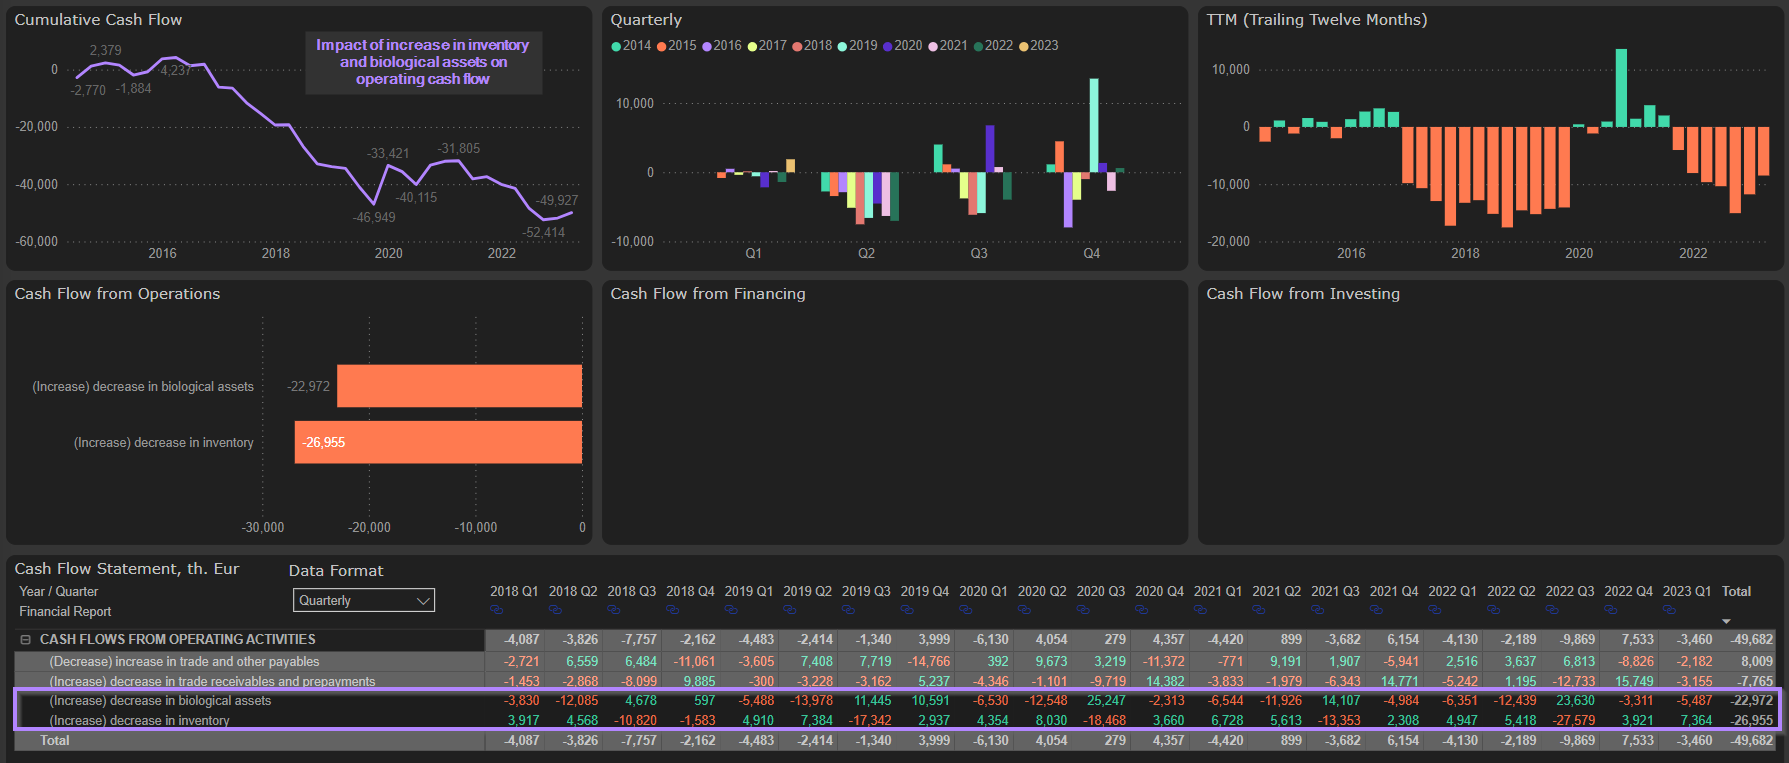
You can also add together as many cash flow items as you wish to see and analyze the result. E.g., select specific items from Working capital and see their impact on cash flow:
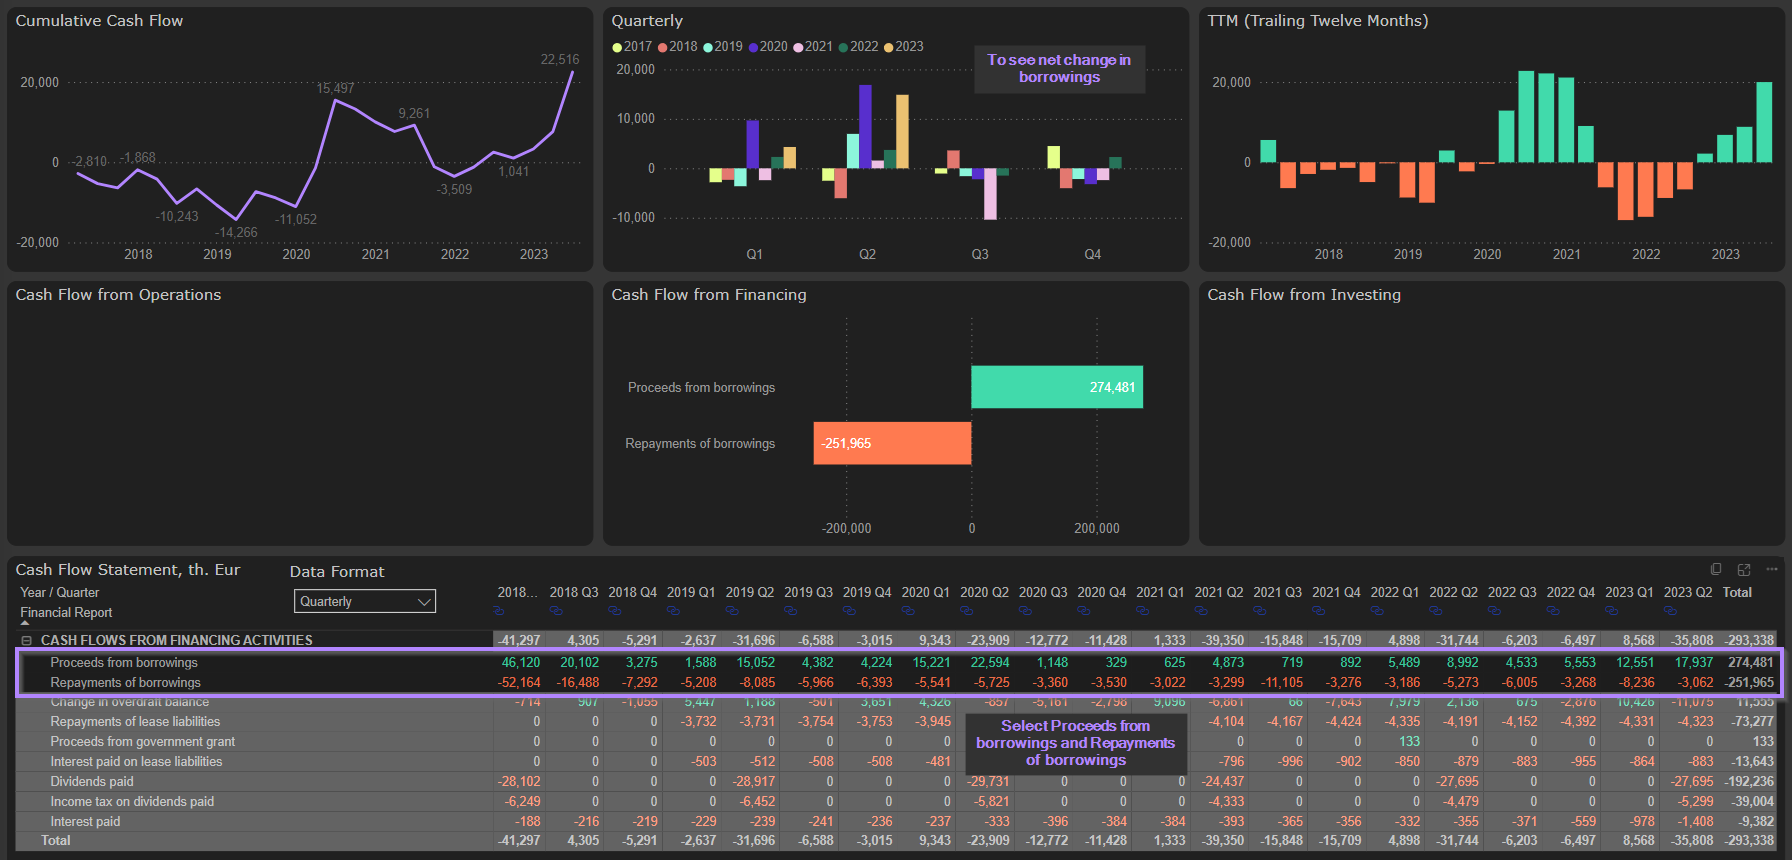
Or select proceeds from borrowings and repayments of borrowings to see net change in borrowings:
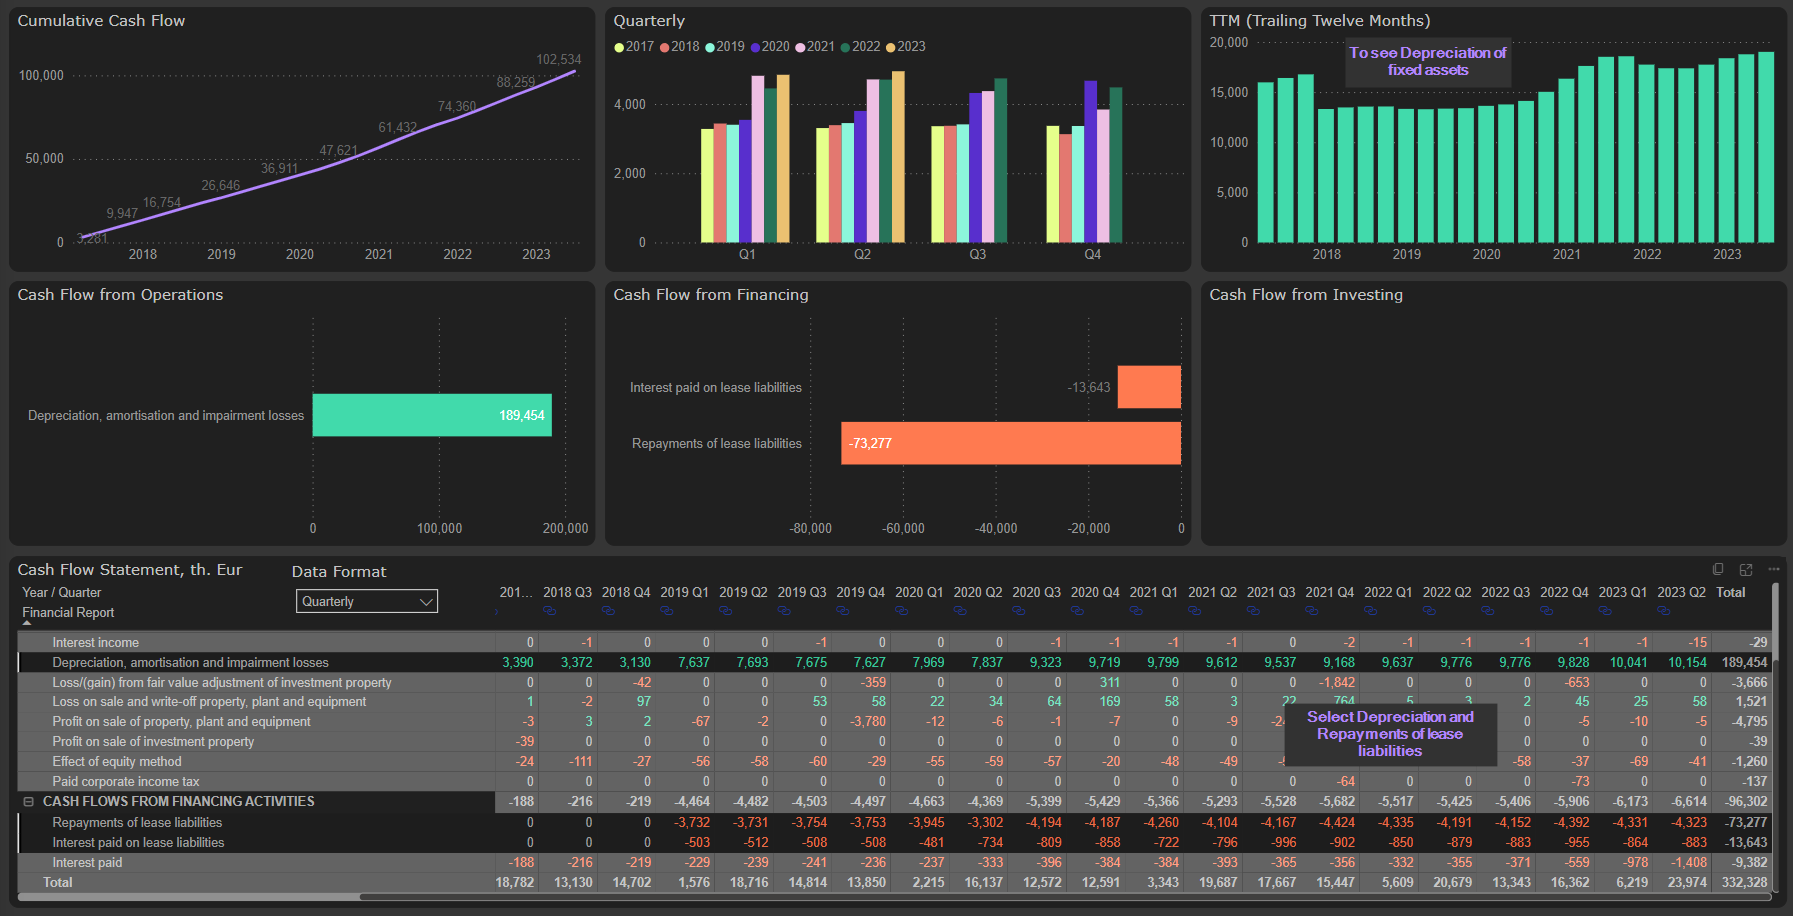
Or select depreciation and repayments of lease liabilities to see depreciation of fixed assets (excluding depreciation of right-of-use assets):